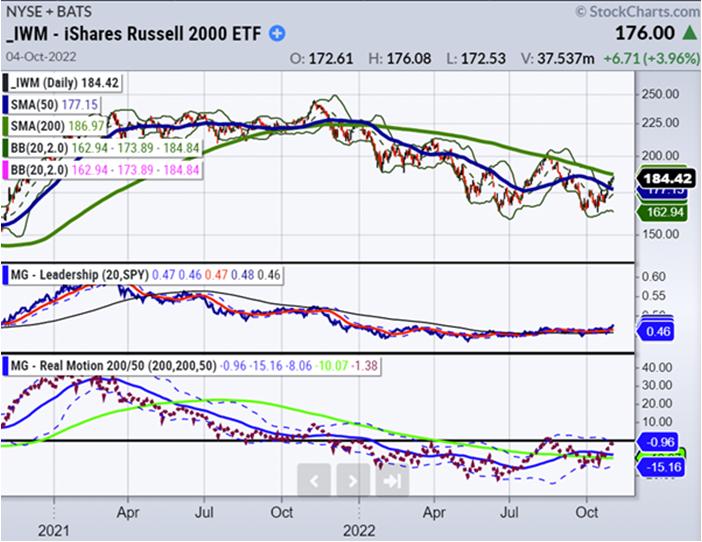
 IWM is about to reclaim and cross its 200-day moving average and the Real Motion Indicator is crossing the zero-line displaying strong upward momentum. IWM looks to be on the verge of a strong breakout.
Since the market's dramatic intraday reversal at the lows of the year on Oct. 13, the equity indexes have rallied in the face of headwinds from rising interest rates, lowered earnings expectations, big high-profile earnings misses, and the uncertainty of tomorrow's Fed announcement.
This may be a bear market rally, but it has interesting leadership in two ways. First, the Dow has had the biggest percentage gain off the October low relative to the SPY, QQQ and IWM, but that can be attributed to just a handful of stocks. Secondly, and more noteworthy for the durability of the rally, is what's happening between the SPY, QQQ and IWM.
The chart below provides a good explanation for why stock indexes have rallied during earnings season. As you can see by the green line that represents the average trajectory of consensus Q3 earnings estimates since 2014, they tend to decline this time of year. This year's trajectory has been significantly lower than normal.
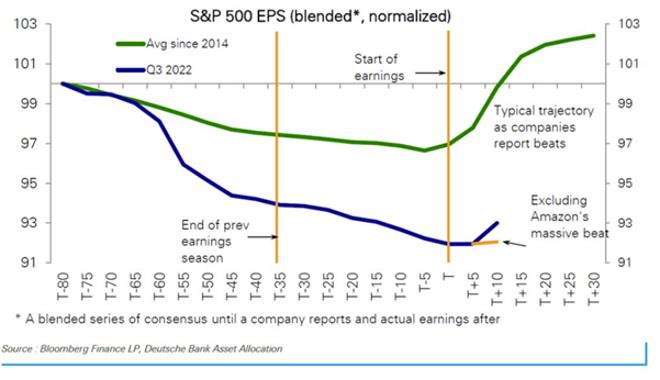
Additionally, they have come down for every sector except for three: Energy, Transportation and Auto. Some of the worst declines have been -21.2% for construction, a -16.4% decrease for technology, a -15.3% loss for retail, a -14.6% decrease for consumer discretionary, and a -10.7% fall for industrials.
With 52% of the S&P 500 having reported, 71% have reported better-than-expected results. This is below the 5-year average of 77%, but with such low expectations to beat, markets have been able to rally. The rally, however, has not been equal between the SPY, QQQ and IWM. The Russell 2000 (IWM) has been the leader by several measures.
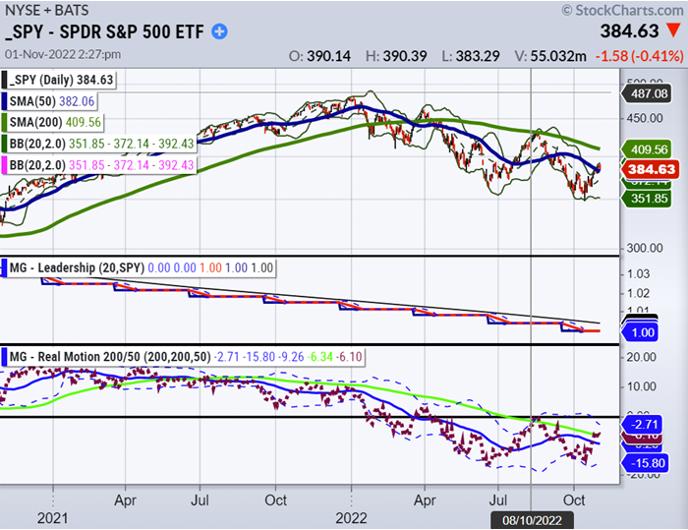
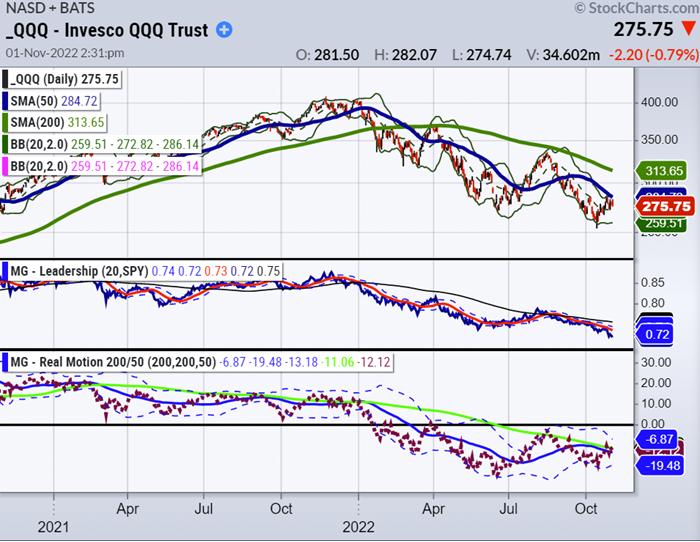
On a percentage basis since Oct. 12th, IWM is up over 9% while the SPY and QQQ are up about 7% and 4% respectively. On a relative basis, IWM is well above its 50-DMA and closing in on its 200-DMA, while the SPY is sitting at its 50-DMA and QQQ has yet to touch its 50-DMA.
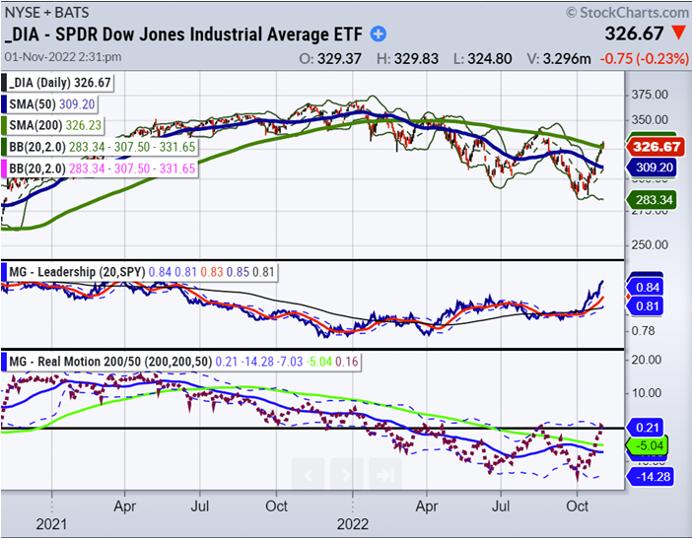
As you can see in the charts below, all indexes are near either their 50- or 200-DMA's as we head into the Fed's announcement tomorrow. The last bear market rally ended in August with the 200-DMA acting as the ceiling. The DIA and IWM are back or about to challenge these key resistance levels again.
The leadership performance of the IWM suggests that it is the one to watch for insight into whether the equity indexes will continue higher or roll over at their respective resistance levels.
To learn more about Mish's trading service or how our Real Motion Trading Indicator and our TriplePlay Trading Indicator integrate on trading platforms such as StockCharts, Fidelity, and TradeStation, you can sign up for a consultation with Rob Quinn, our Chief Strategy Consultant, here.
Rob can also give pricing and trading software compatibility over a 10-minute call or quick video chat via a one-to-one complementary trading consult.

"I grew my money tree and so can you!" - Mish Schneider
Get your copy of Plant Your Money Tree: A Guide to Growing Your Wealth and a special bonus here.
Follow Mish on Twitter @marketminute for stock picks and more. Follow Mish on Instagram (mishschneider) for daily morning videos. To see updated media clips, click here.
Mish in the Media
Mish goes over Meta and Palantir and discusses how trends are switching on BNN Bloomberg.
Two US Stocks may have bottomed out on CMC Markets. 10/26/2022
Mish is patiently watching Macro Trends unfold on Ameritrade. 10/26/2022
How to Trade Post-Earnings on Business First AM. 10/25/2022
Small caps start the party and rally to resistance on Bloomberg TV. 10/25/2022
Will earnings surpise to the upside? See Mish chat on Real Vision Daily Briefing with Maggie Lake 10/24/2022.
Mish presents "Looking for Inflation in All the Wrong Places" for Against All Odds Research.
ETF Summary
- S&P 500 (SPY): Sold off into previous support (386) with 380 still support and 390 first resistance level to watch.
- Russell 2000 (IWM): 181 still support, 186 same resistance.
- Dow (DIA): 324 support, 328 resistance.
- Nasdaq (QQQ): Sold off into previous support twice (277) and (275) with 273 now support and 277 resistance.
- KRE (Regional Banks): 62 support, 65 resistance level; same as before.
- SMH (Semiconductors): 186 support, 193 resistance.
- IYT (Transportation): 211 support, 215 resistance.
- IBB (Biotechnology): 127 support, 132 first resistance; same as before.
- XRT (Retail): 61 support, 65 resistance; same as before.
Wade Dawson
MarketGauge.com
Portfolio Manager


