
Investors will watch closely tomorrow, as the Consumer Price Index (CPI) print is released, and Wednesday, when the Fed announces its latest rate hike. The expectation is for CPI to be lower and for the Fed to raise interest rates a half-percentage point.
The Dow Jones Industrial Average (represented above by DIA) formed a technical "golden cross" today. This formation occurs when the 50-day moving average (represented by the blue line) shoots above its 200-day moving average (represented by the green line). The golden cross technical formation often precedes a rally in stock or, in this case, an index. It is only one indicator of improving potential market prices. It is not foolproof or guaranteed to yield immediate results, but, when used in conjunction with other indicators and analysis, can be helpful, especially during a bear market.
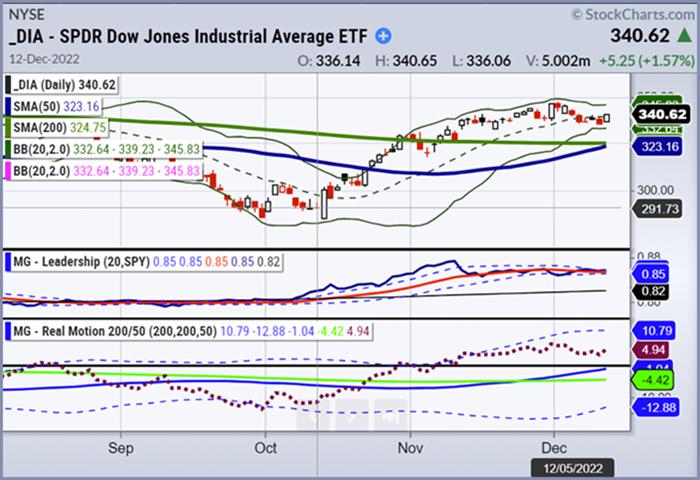
The DIA's recently formed golden cross marks a powerful signal of potential improvement in equity markets amid recessionary headwinds.
Our proprietary Real Motion Indicator above shows that DIA's upward momentum is in line with the positive price action. In other words, we could see further price increases. DIA is showing positive market dominance in our Triple Play Leadership Indicator. That is to say, DIA is showing real strength in a good breakout and still trending higher than the S&P 500 (represented by SPY).
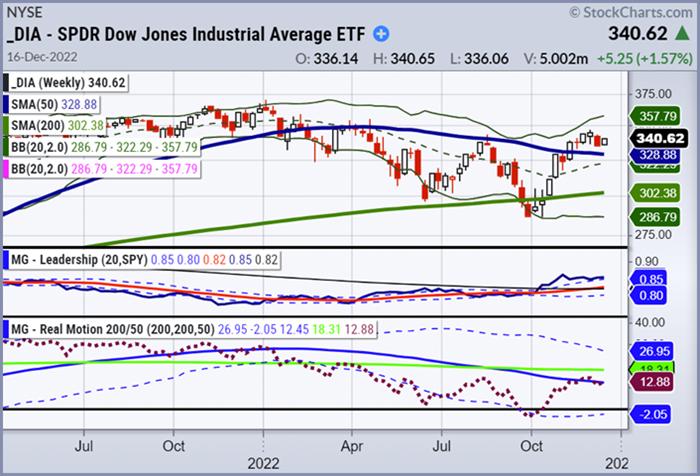
Looking at the weekly chart of DIA, this is the strongest U.S. index and trading above its 50-week moving average and 200-week moving average.
In our Triple Play Leadership Indicator, DIA is displaying clear market dominance. It is trending higher than the S&P 500 Index and showing significant pricing power in a strong breakout compared to the SPY. However, our proprietary Real Motion Indicator above shows that DIA's upward momentum is slightly weaker than the weekly closing price, so watching the weekly trend will be necessary to interpret the golden cross.
Despite appearances, the "golden cross" is not a sure thing. While the indicator could be a trading opportunity, caution is advised, as no guarantee can be given with the deluge of financial data in the days ahead.
On balance, investors should use multiple indicators to confirm trends and never act based solely on one chart-based signal, like a golden cross. Not all golden crosses proceed to a big rally. So, what does this all mean for investors? The takeaway is that investors should watch the DIA closely in the coming days, especially the weekly closing price. While the index has a lot of upward momentum, some signs suggest caution may still be warranted.
Keep an eye on the Triple Play Leadership Indicator and Real Motion Indicator to better understand where DIA is headed. And as always, follow these indicators to stay ahead of the curve in today's market.
If you want to take advantage of our proprietary trading indicators, contact Rob Quinn, our Chief Strategy Consultant, who can provide more information about Mish's Premium Trading Service.
Click here to learn more about Mish's Premium trading service with a complimentary one-on-one consultation.

"I grew my money tree and so can you!" - Mish Schneider
Get your copy of Plant Your Money Tree: A Guide to Growing Your Wealth and a special bonus here.
Follow Mish on Twitter @marketminute for stock picks and more. Follow Mish on Instagram (mishschneider) for daily morning videos. To see updated media clips, click here.
Mish in the Media
Mish discusses trading the Vaneck Vietname ETF ($VNM) in this appearance on Business First AM.
Mish discusses the importance of not adding trading risk into the rest of the year in this appearance on Business First AM.
Read Mish's latest article for CMC Markets, titled "Commodities to Watch in December".
Mish talks stagflation in her interview by Dale Pinkert during the F.A.C.E. webinar.
Watch Mish's appearance on Business First AM here.
Mish hosted the Monday, November 28 edition of StockCharts TV's Your Daily Five, where she covered some of the Modern Family. She also discusses the long bonds and gold with levels to clear or, fail.
Mish discusses "Macro & Market Analysis - Winning Trades in All Markets" in this appearance on the podcast The RO Show with Rosanna Prestia.
ETF Summary
- S&P 500 (SPY): 390 first level of support and 398 resistance. The 50-week MA looms above as overhead resistance 410. Until that clears, this could return to support at the 50-DMA or 380.
- Russell 2000 (IWM): 177 key support and 182 first level of resistance. Similarly, 190 is resistance and now looking at 177 as support; must hold.
- Dow (DIA): 334 first level of support and 341 resistance. As the only index above the 50-WMA, support at 329 is key.
- Nasdaq (QQQ): 280 first key level of support and 286 resistance. Still the weakest index. Hovering on major support at 278 or else trouble ahead.
- KRE (Regional Banks): 57 key support and 63 resistance. After weeks of sideways action, last major support is at 57.00.
- SMH (Semiconductors): 218 support and 226 resistance. If SMH can lead, then 230 is the place to clear and take notice.
- IYT (Transportation): 222-223 key support and 231 resistance. Another one to fail the 50-WMA.
- IBB (Biotechnology): 127 key support and 137 resistance.This has been the year of "do not chase breakouts." Like DIA, is above the 50-WMA; will see if can hold 127 key support or break out to 137 (significant overhead resistance).
- XRT (Retail): 63 first level of support and 67 resistance. Never got the clearance over 67.00, so now we watch 63 and 60 as strong support.
Mish Schneider
MarketGauge.com
Director of Trading Research and Education
Wade Dawson
MarketGauge.com
Portfolio Manager


