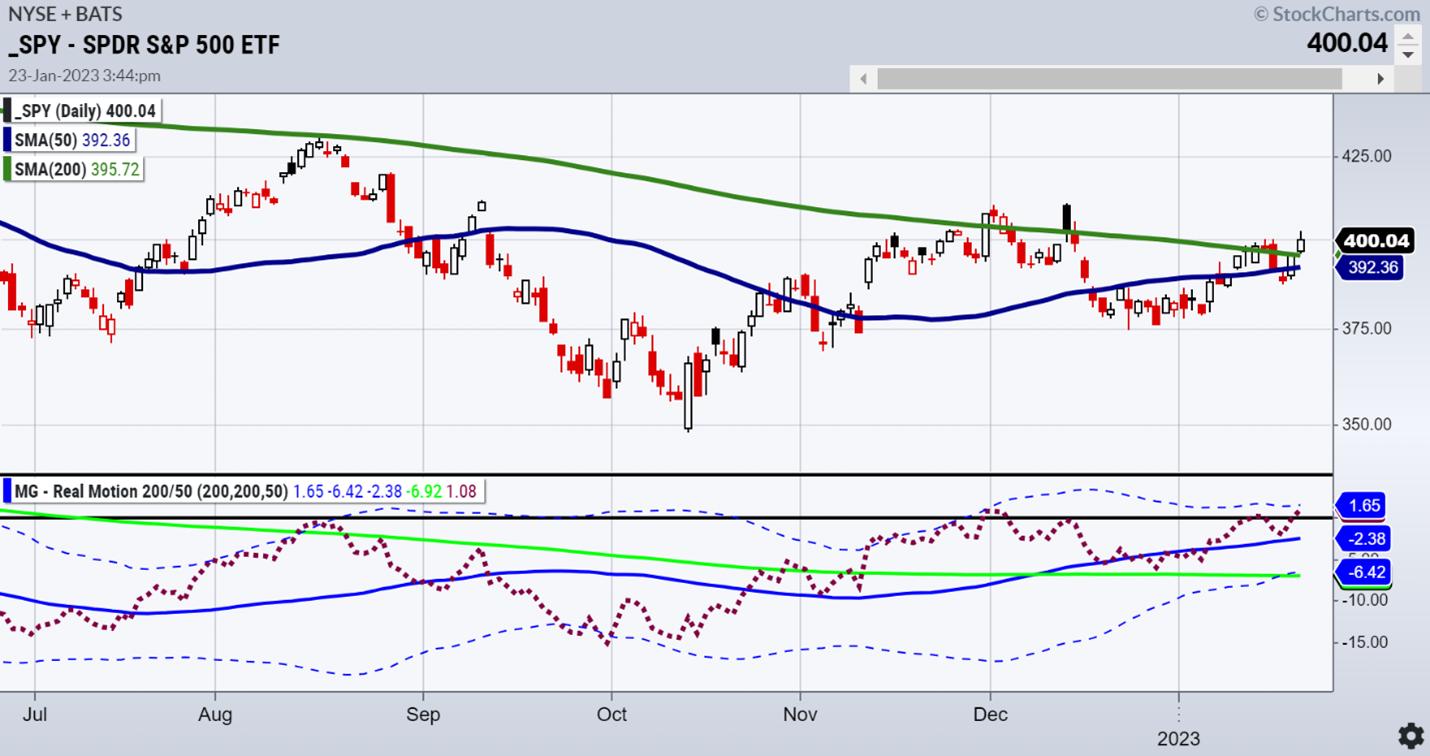
Last week was the reset of the January six-month calendar range. For the S&P 500 index, that range sits at 3770-4000.23.
In our 2023 Outlook, the prediction we made for the yearly range is much wider, or between 3200-4200. That is based on the position of two key monthly moving averages. Looking at the six-month range, today's high was 402.64, but if you look at the SPY chart above, you'll see that it closed at 400.52. That's just marginally above the range and well below the high of the day. Also, interesting to note is the 50-week moving average, which SPY has yet to clear.
So, positive action? Yes!
The signal to go full-blown long? Not so fast. What is momentum telling us?
Before we look at momentum, let's examine a couple of other interesting areas of potential importance right now, ahead of lots of earnings, the PCE number, and a Federal Reserve blackout period.
First off there are the junk bonds and the two ETFs we watch, HYG and JNK. Both are crucial to the market breadth, and both closed red and are underperforming SPY. That makes the exuberance right now suspect.
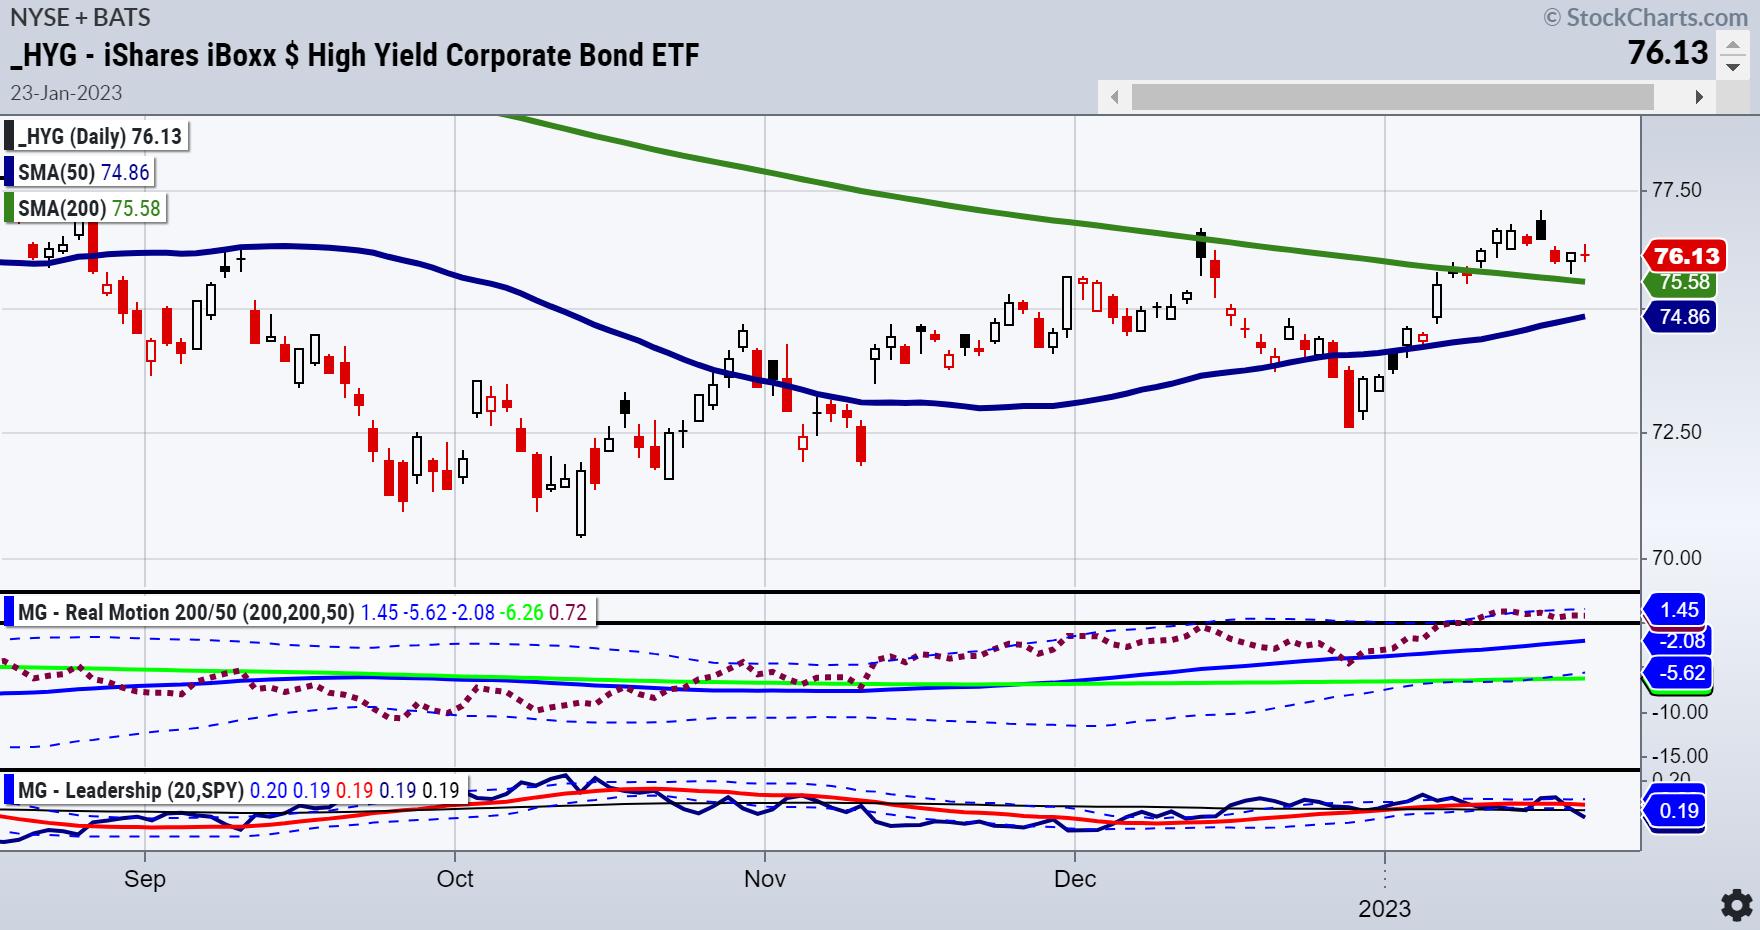
Note the bottom of the chart. The blue line sits well under the red line--that means underperformance.
Our Real Motion Indicator helps to assess growing, slowing, or changing momentum in any and every tradeable financial instrument. As noted by the chart, in high-yield-grade bonds, momentum trades sideways after a sell signal (mean reversion) last week.
Circling back to the SPY, momentum reflects the resistance auspiciously right near the calendar range. Just under the dotted line (Bollinger Band) we need more momentum to be convinced this rally can continue.
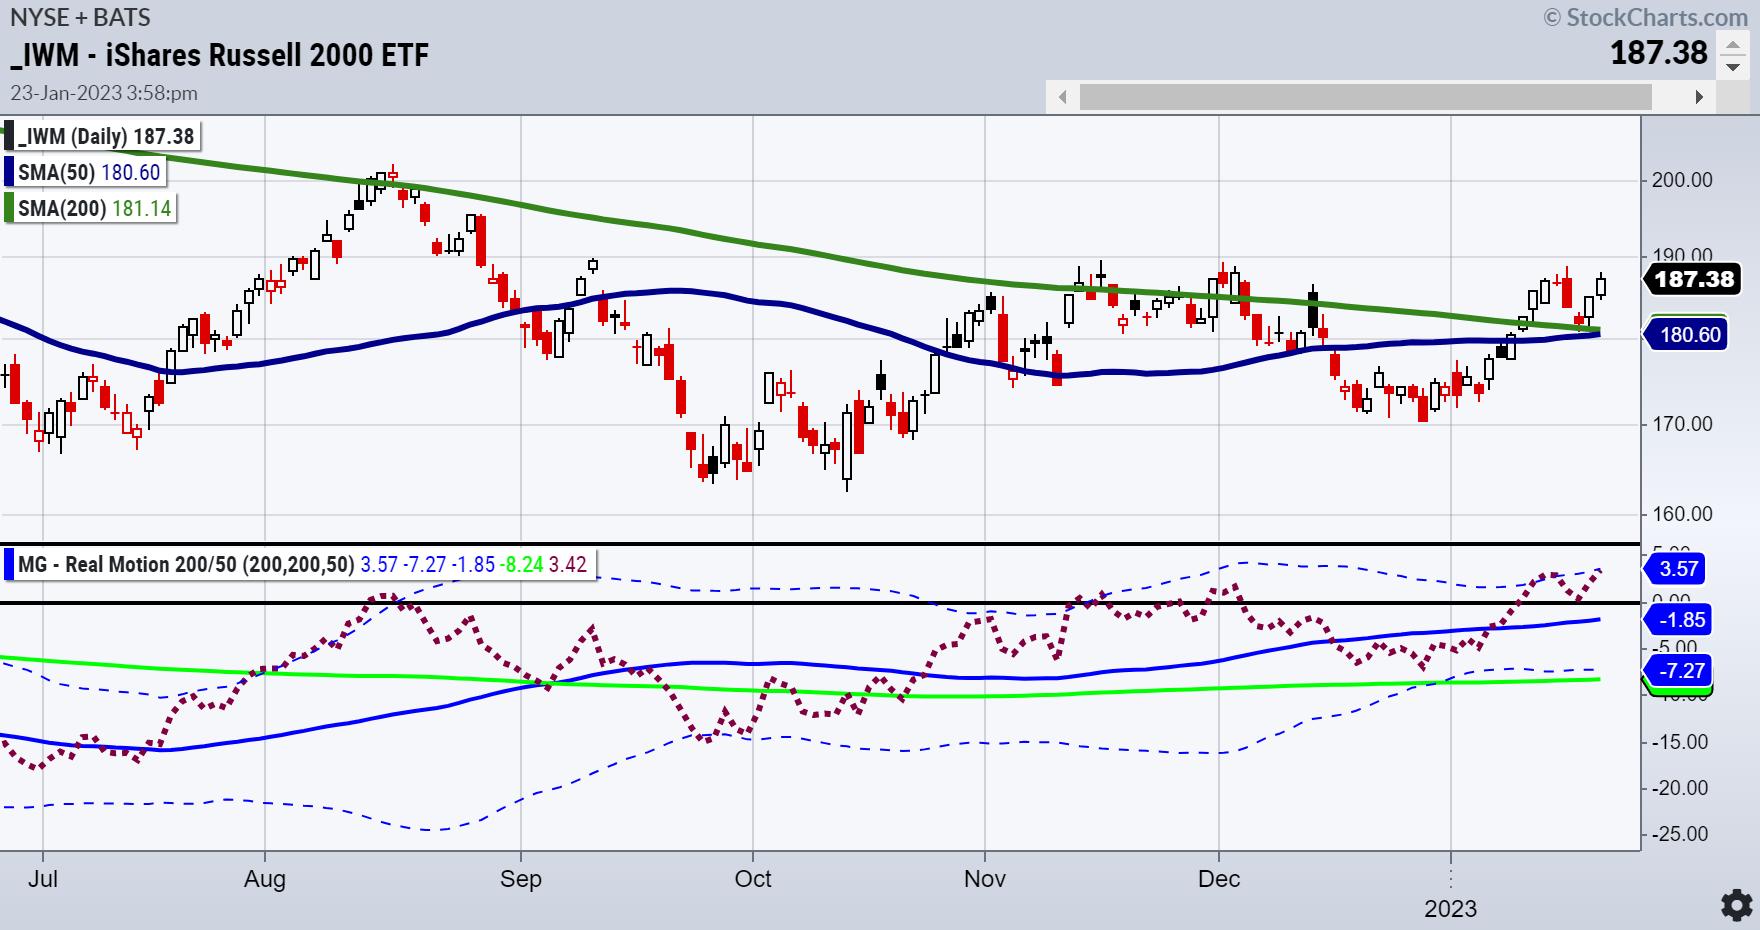
One market that we are keeping a close eye on is small caps.
The Russell 2000 is the leader of the Economic Modern Family. The six-month January range high is 187.84. IWM closed below that level. Momentum tells us that after last week's mean reversion, Monday's retest of the Bollinger Band is worth paying attention to.
Putting it all together:
- SPY rallies to resistance, shows "meh" momentum, but marginally clears the calendar range high--neutral to bullish
- HYG underperforms the SPY and rallies into momentum resistance--neutral to slightly bearish (also trading well under its 6-month calendar range high).
- IWM closes under the calendar range high and momentum tests resistance--neutral to slightly bullish.
Bottom Line
Bulls need to see more--more momentum, higher prices, and high-yield bonds happy.
Bears need to see more--SPY and IWM falling from here, momentum declining, and high yields bonds continuing south.
Yep, it's that close.
Information gathered from:
Mish's Picks are already up 10-20% outperforming the SPY!
Want to take advantage of her stellar track record and ensure a profitable trading year? For more detailed trading information, contact Rob Quinn, our Chief Strategy Consultant, to learn more about Mish's Premium trading service.
You don't want to miss Mish's 2023 Market Outlook, E-available now!

Click here if you'd like a complimentary copy of Mish's 2023 Market Outlook E-Book in your inbox.


"I grew my money tree and so can you!" - Mish Schneider
Get your copy of Plant Your Money Tree: A Guide to Growing Your Wealth and a special bonus here.
Follow Mish on Twitter @marketminute for stock picks and more. Follow Mish on Instagram (mishschneider) for daily morning videos. To see updated media clips, click here.
Mish in the Media
Mish maps out why gold is still the shiniest in this appearance on Making Money with Charles Payne!
In Singapore, Mish discusses China and whether the markets are bottoming or going lower from here on CNBC Asia.
In StockCharts TV's Charting Forward 2023, Mish sits down with a round table panel of experts for an open discussion about the things they are seeing in, and hearing about, the markets.
Mish presents her 2023 Outlook and gives you 6 trading ideas from Macro to Micro on the Thursday, January 12 edition of StockCharts TV's Your Daily Five.
Mish and John discuss how equities and commodities can rally together, up to a point, in this appearance on Bloomberg BNN.
Mish and the team discuss her outlook and why inflation will persist, with a focus on gold, in this appearance on Benzinga.
While the weekly charts still say bear market rally, Mish and and host Dave Keller discuss the promise of the daily charts on the Tuesday, January 10 edition of The Final Bar (full video here).
In this appearance on Business First AM, Mish discusses the worldwide inflation worries.
ETF Summary
- S&P 500 (SPY): SPY has crossed the 200-DMA and is now slightly above it, but is still a very narrow price range below to 50-DMA. Held pivotal support and now what was resistance is support at the 200-DMA. Resistance is 405 overhead.
- Russell 2000 (IWM): Filled the gap and continued to hold the 200-DMA and overhead resistance at 189.
- Dow (DIA): Back under the 50-DMA still as industrials lose ground to tech, but holding support at 335 and looking to cross the 50-DMA at 336.07.
- Nasdaq (QQQ): Crossed the 50-DMA on Friday to close above. First level of resistance is at the 200-DMA and closing slightly below it.
- Regional Banks (KRE): Close to crossing 60.72 (50-DMA). First level of support is 58 and resistance is 50-DMA.
- Semiconductors (SMH): Still holding key support easily at the 50-WMA and 200-WMA. 221 support and 228 resistance.
- Transportation (IYT): Still holding 225 key support here now holding first level of support holding 227.
- Biotechnology (IBB): Still best sector, with 132 key support still holding and holding first level of support at 134, now with 137 resistance.
- Retail (XRT): Holding pivotal support at 63. Resistance at 66.
Mish Schneider
MarketGauge.com
Director of Trading Research and Education
