Welcome to the new year and the new January reset!
The January 6-month calendar range could be even more influential than usual. Let me explain before showing you the S&P 500 (SPY) price chart...
After the first 10-trading days in January, a range is established. That range becomes a guideline for the next 6 months until it resets in July. Should an instrument clear the top of the range by the end of the 10-days, the statistical chance of follow through to the upside is more significant. Conversely, should an instrument break the bottom of the range by the end of the 10-days, the statistical chance of follow through to the downside is more significant. Should the instrument remain within the trading range, then one would expect more chop until the range resolves one way or another.
We at MarketGauge are particularly focused on this upcoming calendar range because of how seamlessly it corresponds with resistance both in price and the moving averages.
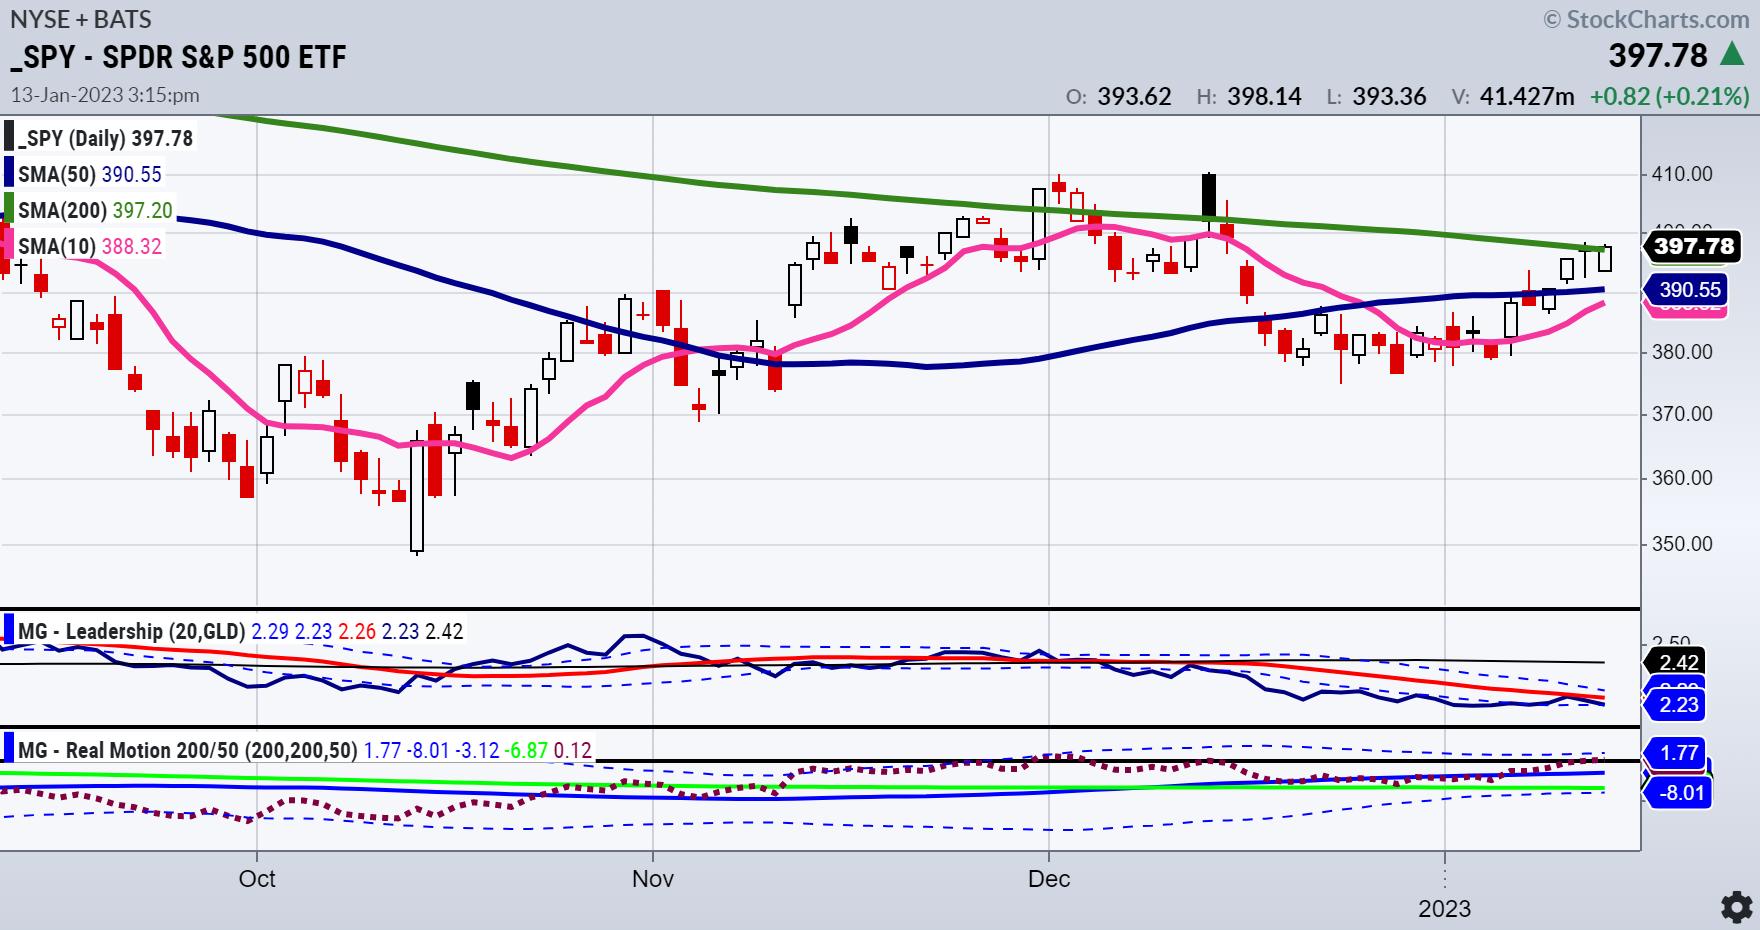
Here is a chart of SPY on a daily timeframe. And for fun, we use Gold (GLD) as our benchmark, straight from our ACP Plug-in and Triple Play Leadership Indicator.
We have completed the first 9 days of trading, which means by Thursday the 19th, the January 6-month calendar range will be set. The price and, very likely, the top of the full 10 days of the trading range corresponds beautifully with the 200-day moving average (green line). And the price and very likely the bottom of the full 10 days of trading range corresponds beautifully with the 50 and 10-day moving averages (blue and cyan lines). How clean is that?
A break above the price range will also take the SPY into an accumulation phase clearing the 200-DMA, most likely yielding more upside. Conversely, a break below the price range will also take the SPY into a bearish phase below the 50 and 10-DMAs, most likely yielding more downside.
Look how SPY is underperforming gold. Inflation peaked you say? Gold versus the SPY says otherwise. Also note that our other ACP Plug-In from Triple Play or Real Motion (momentum indicator), is stronger, above both the positively sloped and stacked 50 and 200 moving averages. However, the RM indicator is also into resistance at the Bollinger Band, which could suggest an overbought SPY with a mean reversion on the horizon.
Regardless, we are ready and excitedly waiting to see which way the January calendar range resolves.
Of course, there are other factors to watch along with the calendar ranges. And every instrument will create a range. So, keep a big eye on what happens once the 6-month range is established. At that point, you will have another reliable indicator to follow, which should help you eliminate the noise of the talking heads.
You don't want to miss Mish's 2023 Market Outlook, E-available now!

Click here if you'd like a complimentary copy of Mish's 2023 Market Outlook E-Book in your inbox.

Mish's Picks are already up 10-20% outperforming the SPY!
Want to take advantage of her stellar track record and ensure a profitable trading year? For more detailed trading information, contact Rob Quinn, our Chief Strategy Consultant, to learn more about Mish's Premium trading service.

"I grew my money tree and so can you!" - Mish Schneider
Get your copy of Plant Your Money Tree: A Guide to Growing Your Wealth and a special bonus here.
Follow Mish on Twitter @marketminute for stock picks and more. Follow Mish on Instagram (mishschneider) for daily morning videos. To see updated media clips, click here.
Mish in the Media
In StockCharts TV's Charting Forward 2023, Mish sits down with a round table panel of experts for an open discussion about the things they are seeing in, and hearing about, the markets.
Mish presents her 2023 Outlook and gives you 6 trading ideas from Macro to Micro on the Thursday, January 12 edition of StockCharts TV's Your Daily Five.
Mish and John discuss how equities and commodities can rally together, up to a point, in this appearance on Bloomberg BNN.
Mish and the team discuss her outlook and why inflation will persist, with a focus on gold, in this appearance on Benzinga.
While the weekly charts still say bear market rally, Mish and and host Dave Keller discuss the promise of the daily charts on the Tuesday, January 10 edition of The Final Bar (full video here).
In this appearance on Business First AM, Mish discusses the worldwide inflation worries.
ETF Summary
- S&P 500 (SPY): Closed above the 200-DMA, now has to stay above and clear 400.
- Russell 2000 (IWM): Can this get through 190? A gamechanger if it does.
- Dow (DIA): Dec high 348.22 now looms.
- Nasdaq (QQQ): Confirmed recuperation phase and right at the 200-WMA resistance of 281.
- Regional Banks (KRE): Still the most concerning sector, with 60 pivotal and under 57 lights out. Needs to clear 65 to stay in the game.
- Semiconductors (SMH): Another nail-biter, stopping right at the 50-WMA or 226.
- Transportation (IYT): Also stopped at the 50-WMA or 231.50.
- Biotechnology (IBB): 138.74 December high the place to clear, with 130 key support.
- Retail (XRT): Amazing how the Jan 6-month range and these 50-WMAs line up in the Economic Modern Family. 66.70 to clear and hold if good.
Mish Schneider
MarketGauge.com
Director of Trading Research and Education
