On Monday, the Daily covered some of the warning signs, particularly in the Regional Banks and Transportation sectors. We ended the Daily by writing this: "Transportation and Regional Banks make up nearly 1/3 of the Economic Modern Family."
On their weakness: "Of course, the week is young, so we have time to see if both sectors play catch up or are sending us a meaningful warning message. Either way, they are not to be ignored."
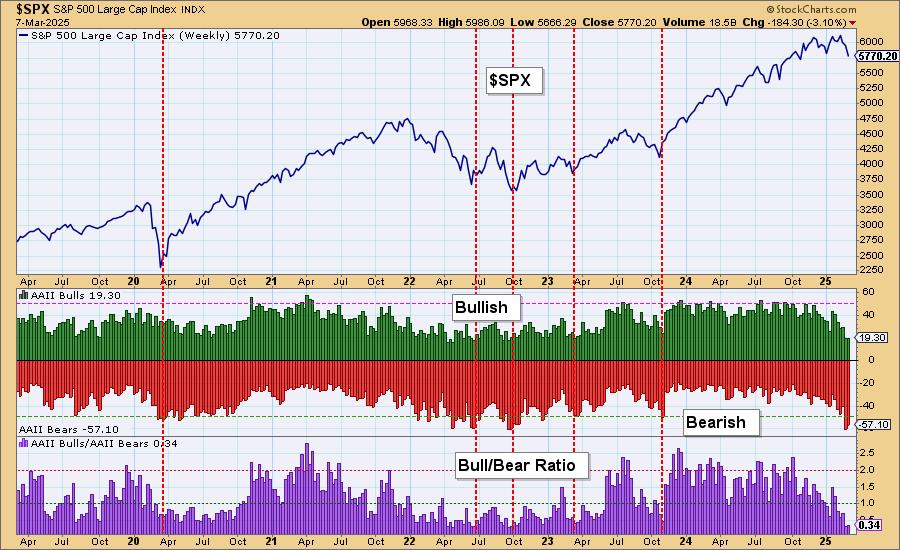
Apparently, they heard us. Both sectors rallied with the overall market. We are still sticking to the trading range thesis -- max upside for the SPY is 420, with 400 the pivotal area to hold.
Also, have you noticed that many commodities flew today as well? Coffee ($COFFEE), sugar ($SUGAR), lumber ($LUMBER), wheat ($WHEAT), Invesco DB Agricultural ETF (DBA), and orange juice to name a few. The Fed may not have noticed, and that should have investors worried down the line.
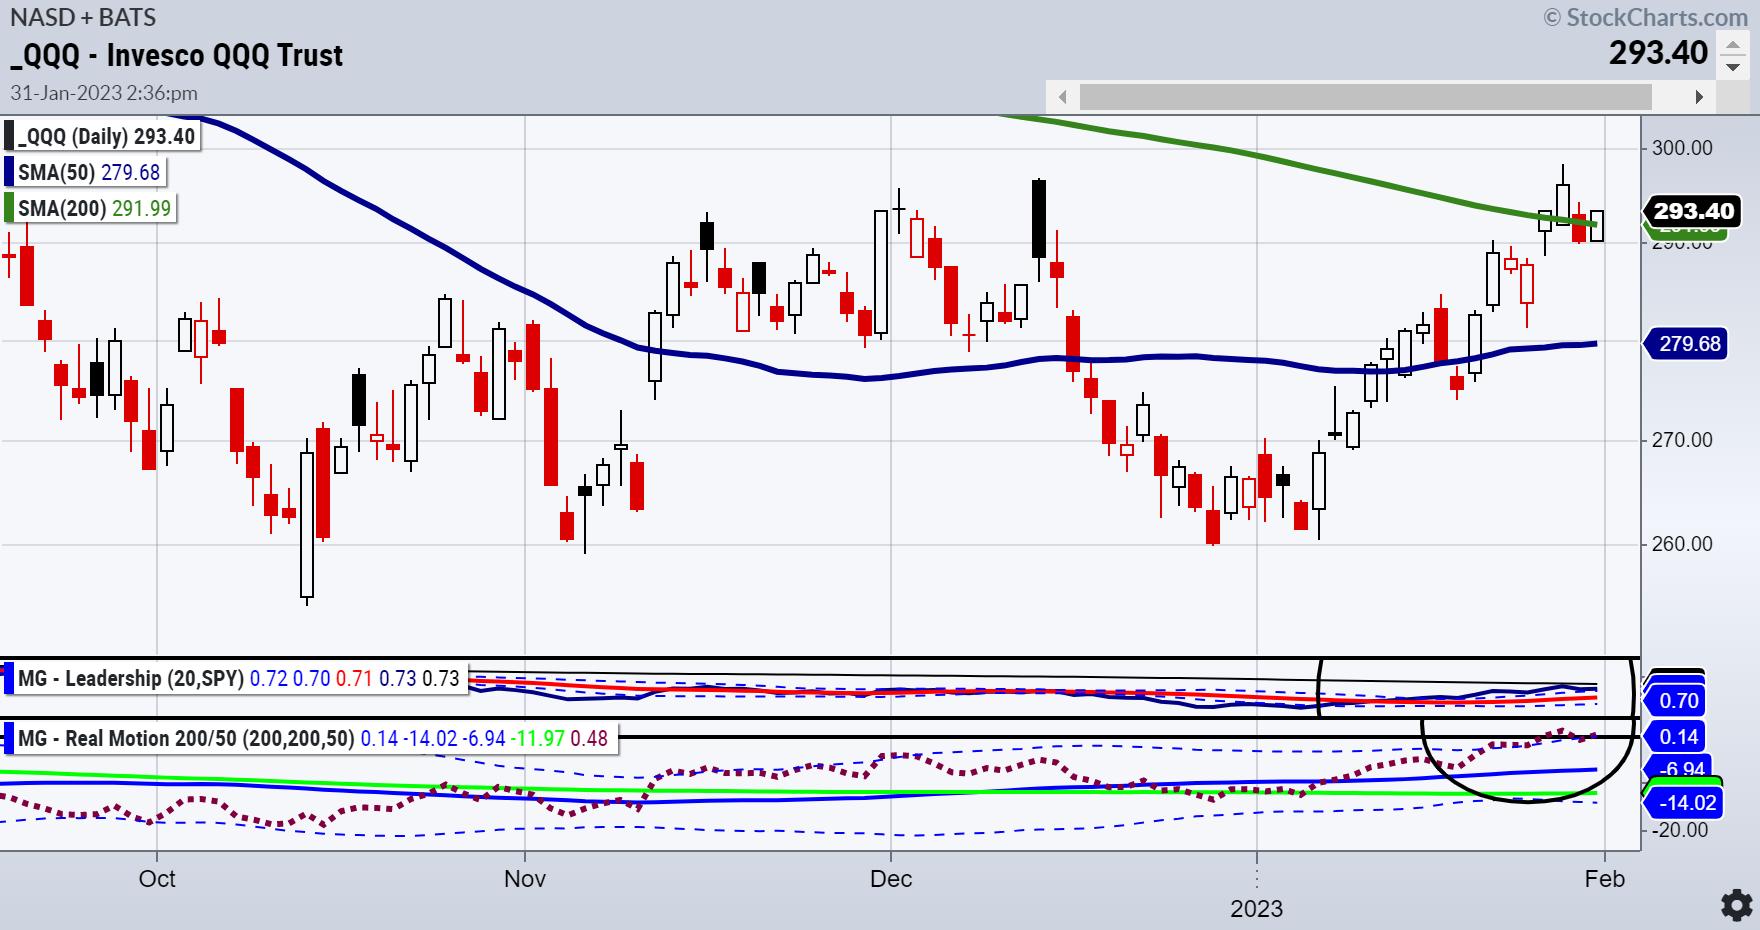
Nonetheless, let us cover the chart of the Invesco QQQ Trust (QQQ) for the good news (see chart above). Note the two elliptical black circles at the bottom of the chart. The one on the top line is an indicator from our Triple Pay tool, Leadership. Currently, the QQQs are outperforming the benchmark SPY. Yet, similar to price, there is resistance near last Friday's price. Growth has overtaken value for now, seemingly on the ideas that Fed will pause and inflation has peaked.
The Real Motion indicator proves to be even more fascinating. The price chart shows the 50-day moving average (MA) below the 200-day MA by a sizable margin. The inference is that, by the time the 50-day MA catches up (if it catches up), the rally could be at the end of its run. Furthermore and not surprisingly, the price level it was trading at on Tuesday is inside the trading range of Monday.
As far as the momentum though, the RM chart illustrates a clear divergence. Momentum, first off, had a golden cross (50-day MA clears the 200-day MA.) Secondly, the red-dotted line (momentum gauge) is well above both moving averages. This means that momentum is well outpacing price. Now, we wait for the price to confirm by closing above its 200-day MA.
Auspiciously, with FOMC Wednesday, that could happen or not happen very quickly. MarketGauge's Nasdaq 100 All-Stars Trading Model has over 40% position profits right now. Tuesday night, before the start of the new month, that model will rank the strongest stocks in the NASDAQ. Again, auspiciously ahead of the FOMC.
Is momentum telling us that the NASDAQ 100 has a new leg higher on the horizon? We believe that inflation will eventually put the kibosh on growth stocks and most likely most stocks. But, for now, the math looks like that notion is discounted, for now.
For more detailed trading information about our blended models, tools and trader education courses, contact Rob Quinn, our Chief Strategy Consultant, to learn more.
You don't want to miss Mish's 2023 Market Outlook, E-available now!

Click here if you'd like a complimentary copy of Mish's 2023 Market Outlook E-Book in your inbox.


"I grew my money tree and so can you!" - Mish Schneider
Get your copy of Plant Your Money Tree: A Guide to Growing Your Wealth and a special bonus here.
Follow Mish on Twitter @marketminute for stock picks and more. Follow Mish on Instagram (mishschneider) for daily morning videos. To see updated media clips, click here.
Mish in the Media
Kristin and Mish discuss whether or not the market has run out of good news in this appearance on Cheddar TV.
Harry Melandri and Mish discuss inflation, the Federal Reserve, and all the sparkplugs that could ignite on Real Vision.
Jon and Mish discuss how the market (still rangebound) is counting on a dovish Fed in this appearance on BNN Bloomberg.
Mish discusses price and what indices must do now in this appearance on Making Money with Charles Payne.
In this appearance on TheStreet.com, Mish and JD Durkin discuss the latest market earnings, data, inflation, the Fed and where to put your money.
In this appearance on CMC Markets, Mish digs into her favourite commodity trades for the week and gives her technical take on where the trading opportunities for Gold, oil, copper, silver and sugar are.
ETF Summary
- S&P 500 (SPY): Let's not forget the Dec. highs and 400 support.
- Russell 2000 (IWM): Canceled the glass ceiling--good thing 202 is major resistance.
- Dow (DIA): 2 inside weeks developing--that will be interesting by Friday.
- Nasdaq (QQQ): Glass ceiling still in place until it clears 298.26.
- Regional Banks (KRE): Rallied right to the 200-DMA--if clears 64 next.
- Semiconductors (SMH): Glass ceiling still in place until it clears 241.19.
- Transportation (IYT): Nice comeback--now must clear and close over 232.55.
- Biotechnology (IBB): Multiple timeframes count and this failed the 23-month MA so far.
- Retail (XRT): Granny wakes up and is in the lead--inflation not felt here at this point, until then very positive.
Mish Schneider
MarketGauge.com
Director of Trading Research and Education