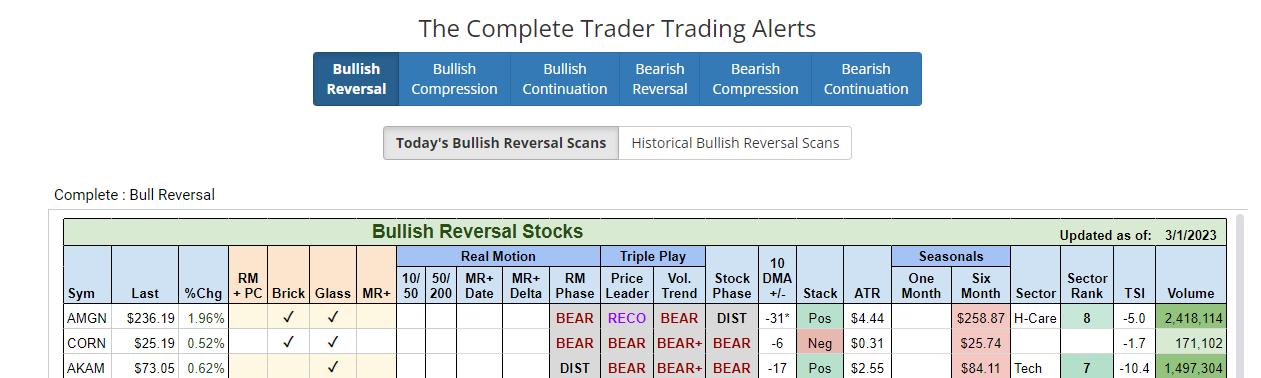
Those of you who read our Daily are by now, learning about the value of our scanning tools, quants and the Complete Trader. What we are trying to accomplish is to show not only how best to use the product, but how to focus on key patterns, especially those that are in line with megatrends.
For example, on February 21st, Classic Short Setup in Tech featured Akami (AKAM). At the time, the stock closed at $76.40. The stock fell to a low of $72.14 in 6 trading days. Now, you see it on the Bullish Reversal Scan. However, buying it does not interest us. The stock is in a major downtrend. So, I would take the information to either take some profit, if short, or lower the stop, to cover to ensure a profit regardless of what happens from here.
What does interest us though, is the Bullish Reversal in CORN.
Incidentally, Amgen Inc.'s (AMGN) a bit more interesting, as it also reversed right after it touched down on the 200-week moving average. But that's not the focus for now.
The CORN ETF is of interest, as agricultural commodities have fallen a lot lately.
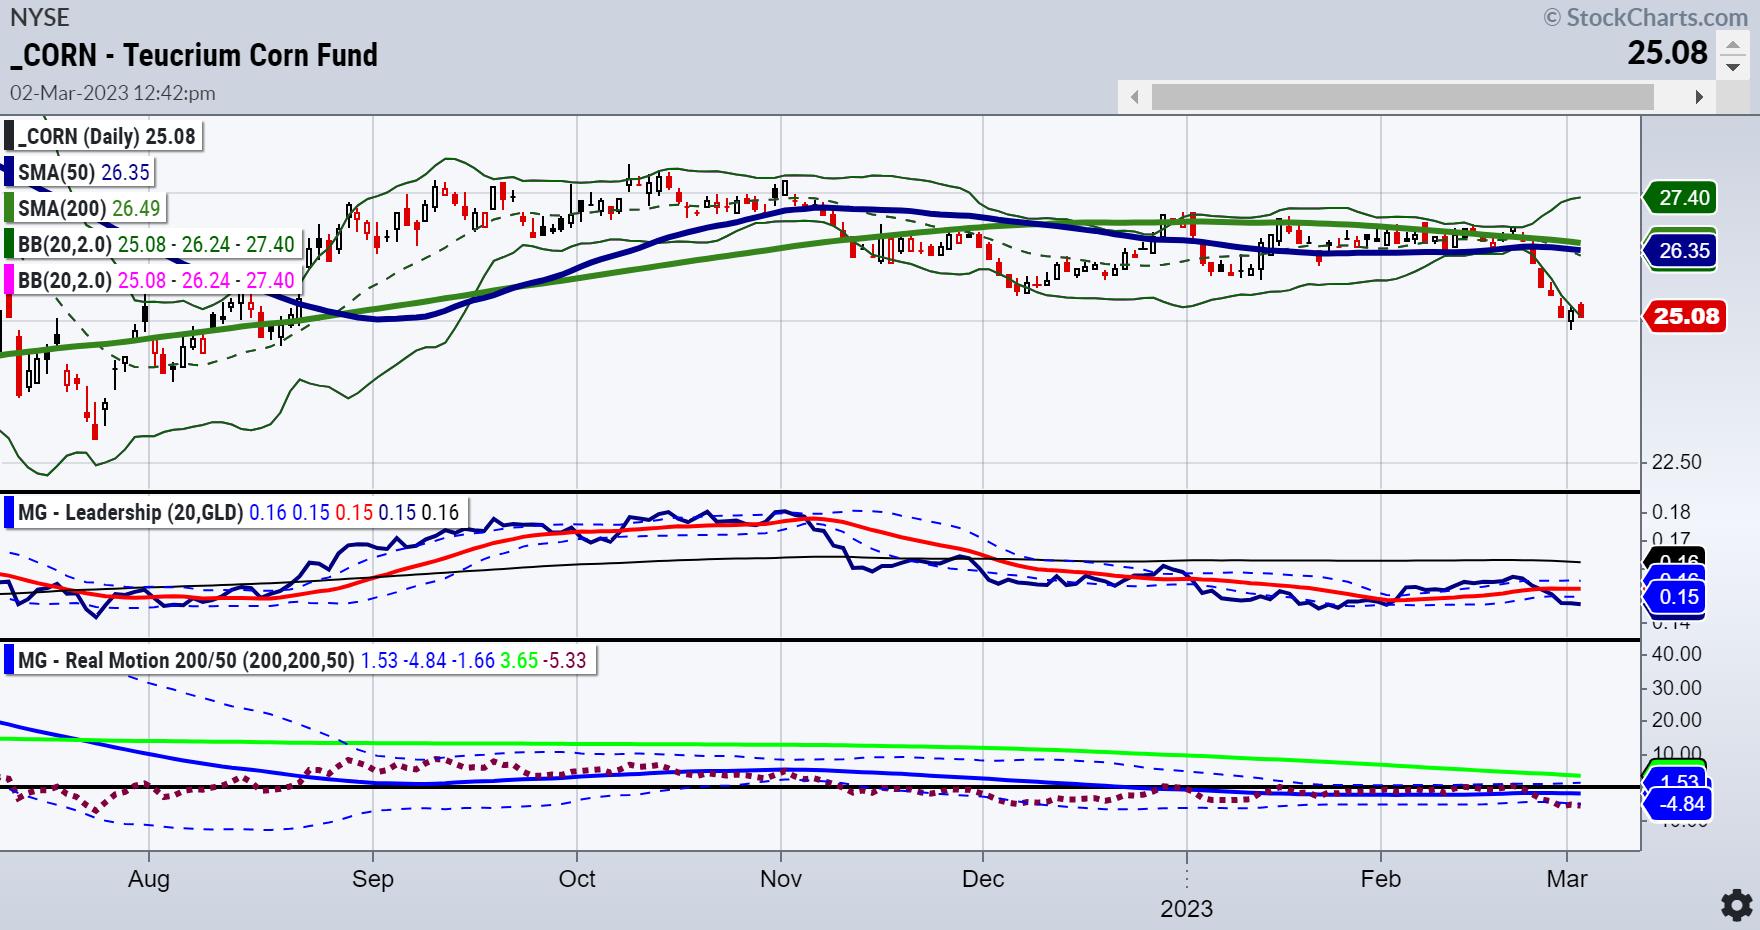
As far as we can tell, food supply and shortages remain a concern going into the spring and summer growing seasons.
The Complete Trader Scan checks off 2 boxes -- Brick and Glass Bottoms.
The Brickwall pattern is a 2-day pattern where the stock puts in a new 60-day low on wide-range move and then reverses and closes the next day in the upper portion of its trading range. The price phase is bearish. Momentum as illustrated by Real Motion, indicates a bearish trend. Although as you can see from the chart of CORN, it has the potential for a mean reversion.
The monthly chart is also interesting.
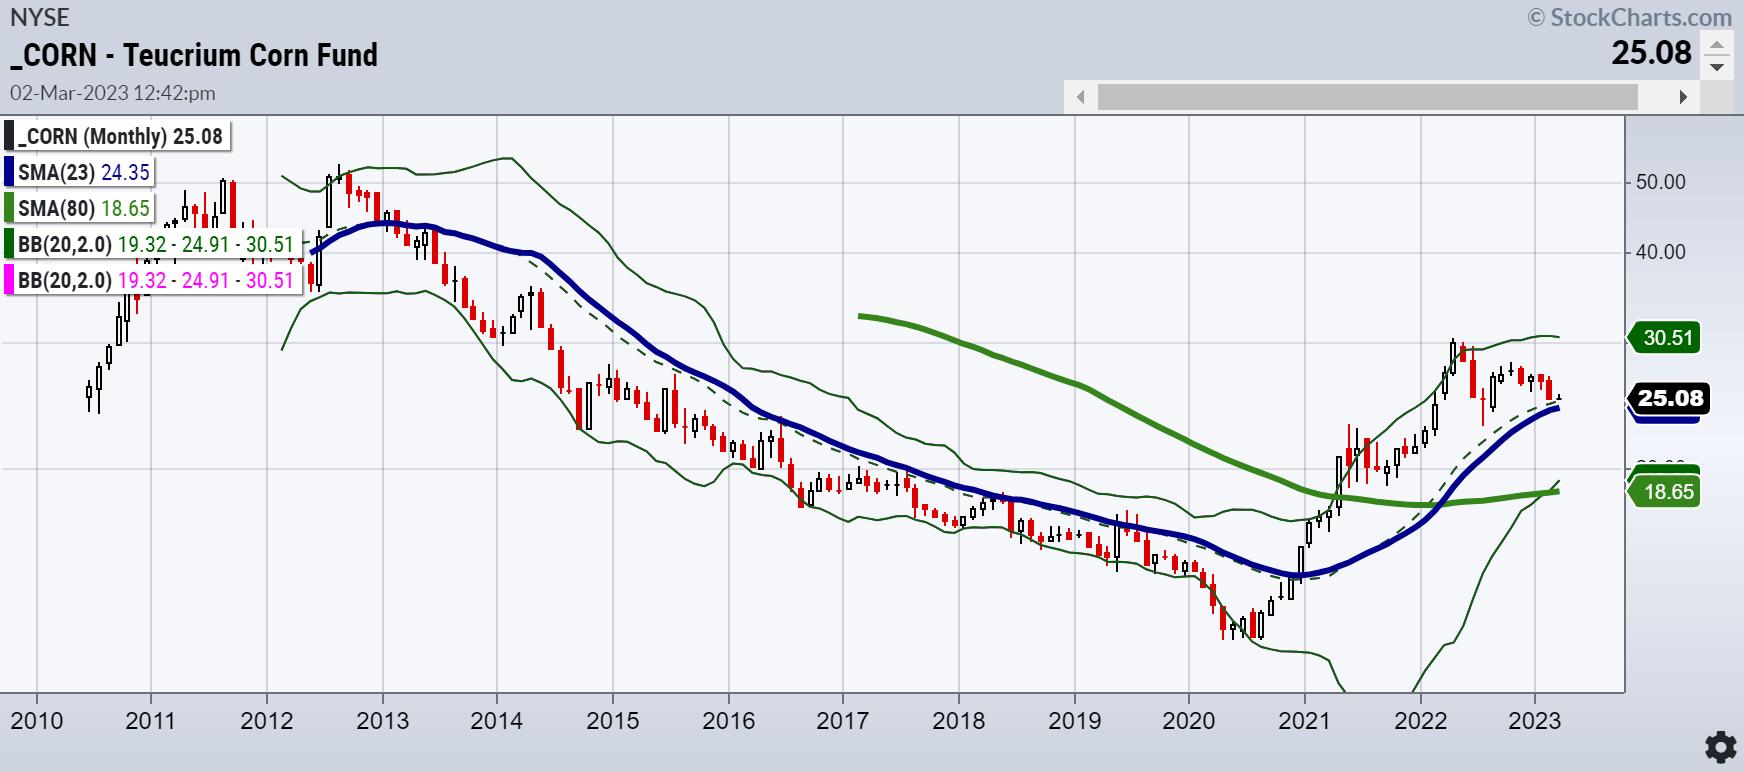
Note how the price holds the 23-month moving average or the 2-year business cycle-still intact. That is positive. And a good risk point.
Going back to the daily chart, we would want to see the price clear over Tuesday's high or the reversal day high. Moreover, watch for a mean reversion on Real Motion. It is a bit of a trip back to the overhead 50 and 200-DMAs. But REMEMBER: We never know the future, yet we can ascertain the past by seeing where to place a good stop loss to control risk.
Last note -- the topic of March 1st Daily was Steel Dynamics (STLD), which, we commented, "may be on the verge of another breakout after a month of price consolidation." The stock closed up nearly 3% today.
MarketGauge's mission is to bring you education and actionable investing ideas every day!
For more detailed trading information about our blended models, tools and trader education courses, contact Rob Quinn, our Chief Strategy Consultant, to learn more.
IT'S NOT TOO LATE! Click here if you'd like a complimentary copy of Mish's 2023 Market Outlook E-Book in your inbox.


"I grew my money tree and so can you!" - Mish Schneider
Get your copy of Plant Your Money Tree: A Guide to Growing Your Wealth and a special bonus here.
Follow Mish on Twitter @marketminute for stock picks and more. Follow Mish on Instagram (mishschneider) for daily morning videos. To see updated media clips, click here.
Mish in the Media
Mish joins Maggie Lake on Real Vision to talk commodities and setups!
Read about Mish's article about the implications of elevated sugar prices in this article from Kitco!
While the indices remain range bound, Mish shows you several emerging trends on the Wednesday, March 1 edition of StockCharts TV's Your Daily Five!
Mish joins Business First AM for Stock Picking Time in this video!
See Mish sit down with Amber Kanwar of BNN Bloomberg to discuss the current market conditions and some picks.
Click here to watch Mish and StockCharts.com's David Keller join Jared Blikre as they discuss trading, advice to new investors, crypto, and AI on Yahoo Finance.
In her latest video for CMC Markets, MarketGauge's Mish Schneider shares insights on the gold, the S&P 500 and natural gas and what traders can expect as the markets remain mixed.
Mish and Charles talk food inflation and the Metaverse on Making Money with Charles Payne!
ETF Summary
- S&P 500 (SPY): 390 support with 405 closest resistance.
- Russell 2000 (IWM): MA support around 184. 190 has to clear.
- Dow (DIA): 326 support, 335 resistance.
- Nasdaq (QQQ): 300 the pivotal area, 290 major support; 284 big support, 300 resistance.
- Regional banks (KRE): Back to weak link under 60--could be a warning.
- Semiconductors (SMH): 228 support, 240 pivotal, 248 key resistance; 248 resistance, 237 then 229 support.
- Transportation (IYT): 240 resistance as best Mod Fam performer and 230 support.
- Biotechnology (IBB): 125-130 new range.
- Retail (XRT): Comeback a little, but has to clear 66.40 or warning like KRE.
Mish Schneider
MarketGauge.com
Director of Trading Research and Education


