When we wrote How to Grow Your Wealth in 2023, we began with
- Chaos
- Trying to Fit a Square Peg into a Round Hole
- Looking for Inflation in All the Wrong Places
Could we have known at the time what headlines would emerge? No. Yet what was obvious is that "from central banks to sovereign spending and borrowing to geopolitics to anti-globalism to ongoing raw material issues and food shortages to rising global debt--nothing is as it was."
Insert headline?
Here are a few:
- Rates: While ECB raises .50, they also say they will cap at 4%
- Banks: Regional Banks ETF looks lower still with SIVB filing Chapter 11
With $300 Billion added to balance sheet, this is the opposite of QT, and signals a further lack of control.
Banks borrowed $165 billion from the FED, which is more than in 2008.
More from the Outlook on the U.S. Dollar
"Most concerning is that, if dollar drops (just fell from 114 in September to under 104 this past week) then what?
"Will the rate matter at all in the fight against inflation?"
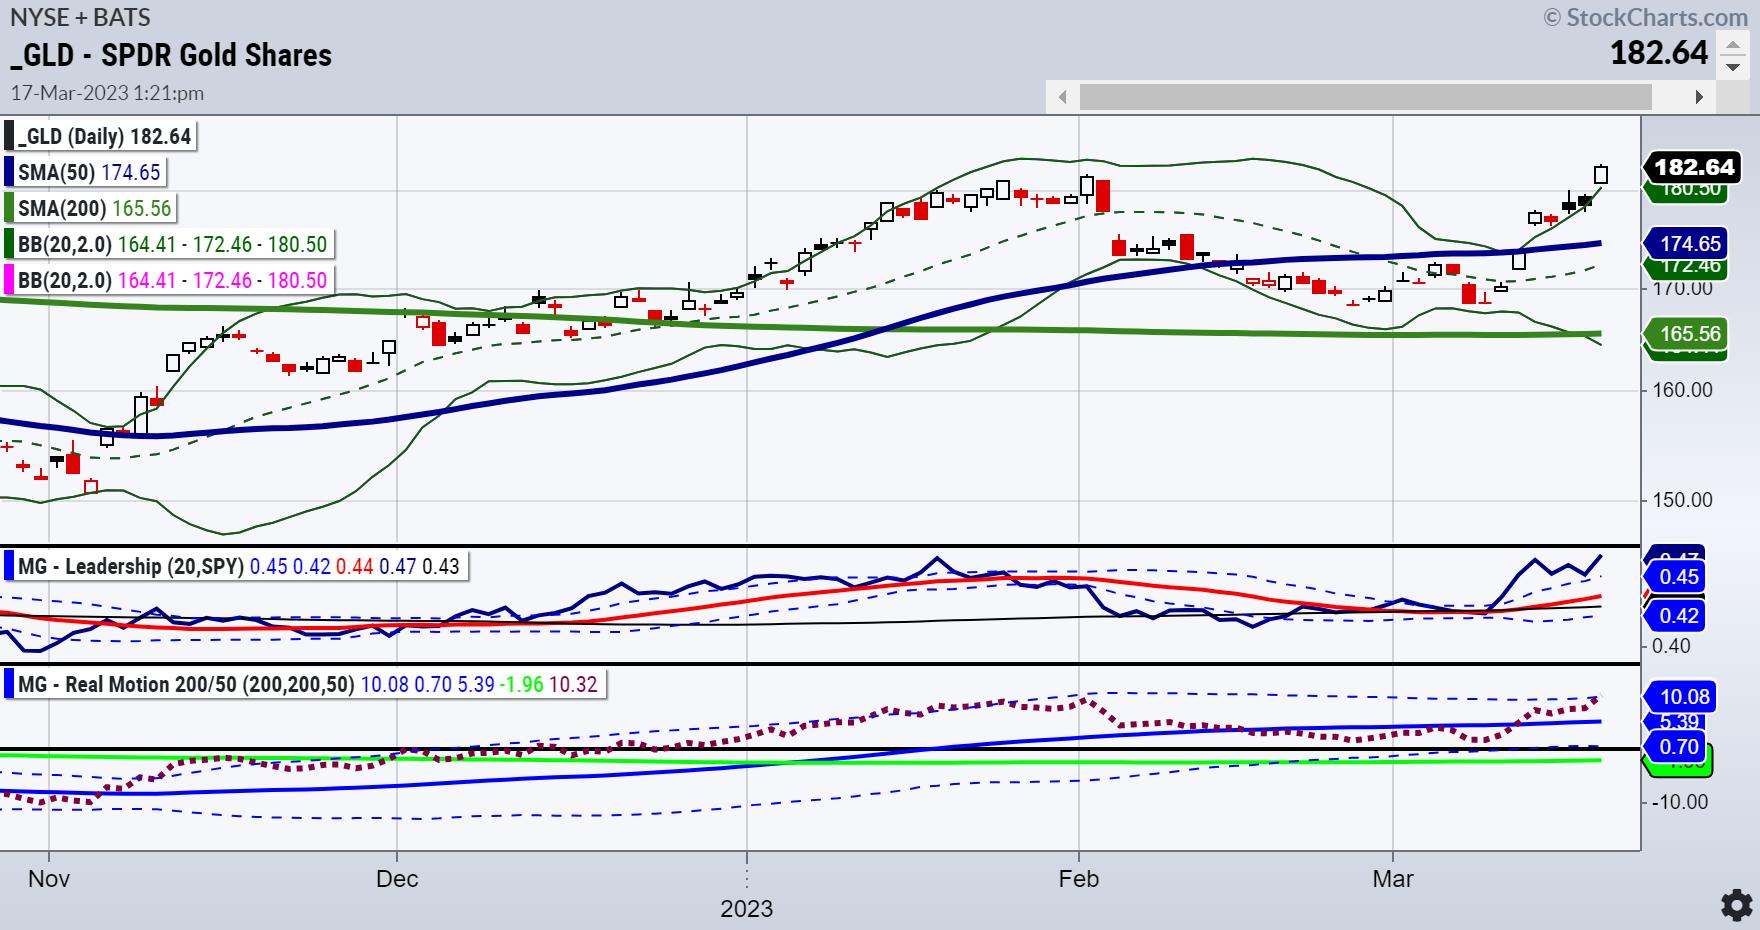
And so, our top pick for 2023 was and still is gold.
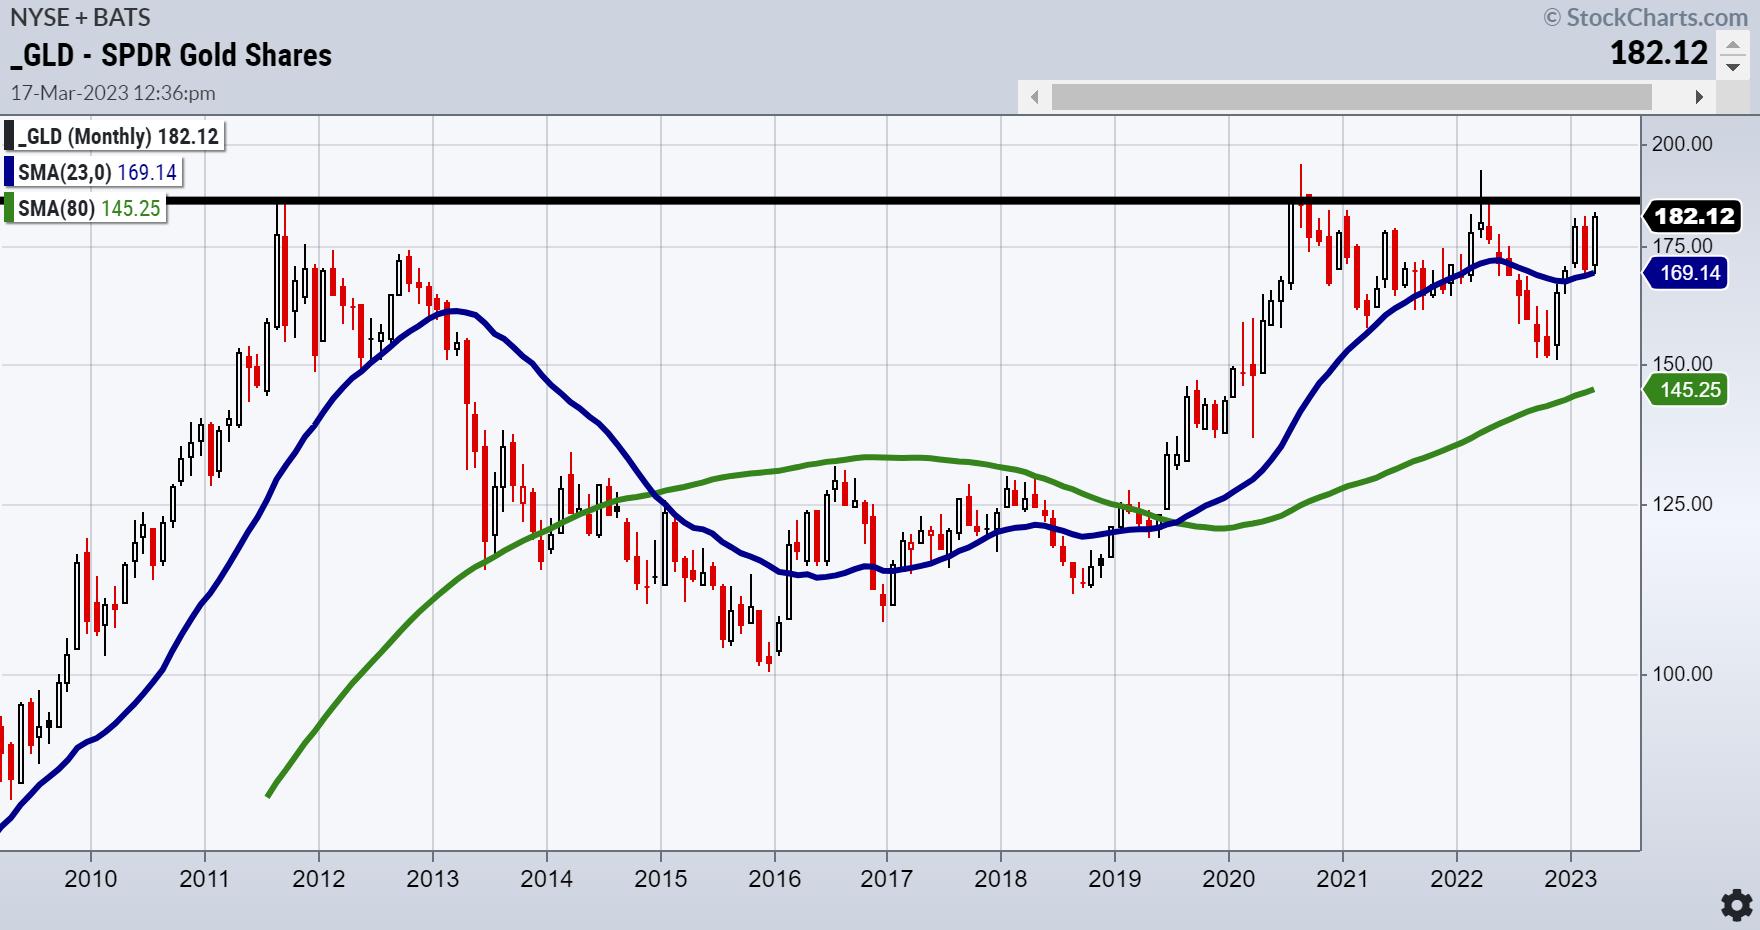
This is the monthly chart of gold as seen through the ETF GLD. It dates to pre-2011, when gold was rising after the 2008 crisis.
In August 2011 another huge headline hit the market:
S.& P. Downgrades Debt Rating of U.S. for the First Time
In August 2011, gold ran up to 184.82 before the political dance resolved and everyone played nice again.
Since then, as seen in the thick horizontal line you see that stretches across the page to this month, GLD has not had a monthly close above those 2011 highs. However, in August 2020 the GLD daily high was a short-lived pop to 194.45, yet later that month GLD closed much lower.
Technicians can see this chart in 2 ways. First, as triple, or even quadruple tops around 184-185. Alternately, a huge inverted 12-year head and shoulders bottom, which if the neckline clears, measures the gold move to around 260. Pretty much close to the 2023 call for gold to double or go to around $3000 an ounce.
You decide which side of the TA call you want to be on. However, watch the dollar as your best indicator.
Under 104, inflation hits us in 2 ways: High cost of goods and lower purchasing power. Of course, keep chaos in your analysis, assuming we have yet to see all the ripple effects of recent headlines (not to mention China, Russia, North Korea all persistently on the back burner).
Forget the Analysts, Follow the Math
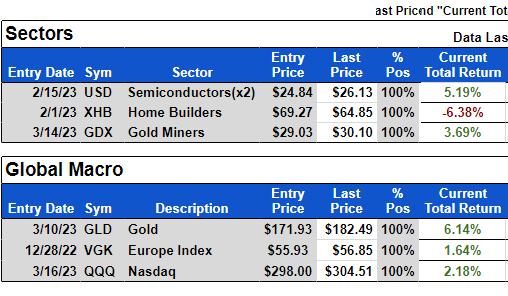
Above is MarketGauge's GEMS Global Macro (Global Equities: Macro Sectors). Current holdings based on MG's proprietary indicators show GLD and gold miners GDX in the portfolio. Additionally, the model holds NASDAQ QQQ and Semiconductors. It will be fascinating to see how the quants will resolve going forward.
Finally, check out my interview with Dave Keller on The Final Bar. Lots of excellent information.
For more detailed trading information about our blended models, tools and trader education courses, contact Rob Quinn, our Chief Strategy Consultant, to learn more.
IT'S NOT TOO LATE! Click here if you'd like a complimentary copy of Mish's 2023 Market Outlook E-Book in your inbox.


"I grew my money tree and so can you!" - Mish Schneider
Get your copy of Plant Your Money Tree: A Guide to Growing Your Wealth and a special bonus here.
Follow Mish on Twitter @marketminute for stock picks and more. Follow Mish on Instagram (mishschneider) for daily morning videos. To see updated media clips, click here.
Mish in the Media
Mish sits down with Kristen on Cheddar TV's closing bell to talk what Gold is saying and more.
Mish and Dave Keller of StockCharts look at longer term charts and discuss action plans on the Thursday, March 17 edition of StockCharts TV's The Final Bar.
Mish covers current market conditions strengths and weaknesses in this appearance on CMC Markets.
Mish sees opportunity in Vietnam, is trading SPX as a range, and likes semiconductors, as she explains to Dale Pinkert on ForexAnalytix's F.A.C.E. webinar.
Mish and Nicole discuss specific stock recommendations and Fed expectations on TD Ameritrade.
Coming Up:
March 20th: Madam Trader Podcast with Ashley Kyle Miller
March 22nd: The RoShowPod with Rosanna Prestia
March 24th: Opening Bell with BNN Bloomberg
March 30th: Your Daily Five, StockCharts TV
March 31st: Festival of Learning Real Vision "Portfolio Doctor"
April 24-26: Mish at The Money Show in Las Vegas
May 2-5: StockCharts TV Market Outlook
ETF Summary
- S&P 500 (SPY): 390 pivotal and 380 support.
- Russell 2000 (IWM): Still weak comparatively -- 170-180 range now.
- Dow (DIA): 310 support, 324 resistance.
- Nasdaq (QQQ): 328 is the 23-month MA resistance, 300 support.
- Regional banks (KRE): 44 support, 50 resistance -- still looks like lower in store.
- Semiconductors (SMH): 255.64 last month's high. 248 nearest support.
- Transportation (IYT): Clutch hold 218 and needs to clear 224 weekly close.
- Biotechnology (IBB): Closed inside the prior week's trading range.
- Retail (XRT): 60 big support and 64 big resistance.
Mish Schneider
MarketGauge.com
Director of Trading Research and Education


