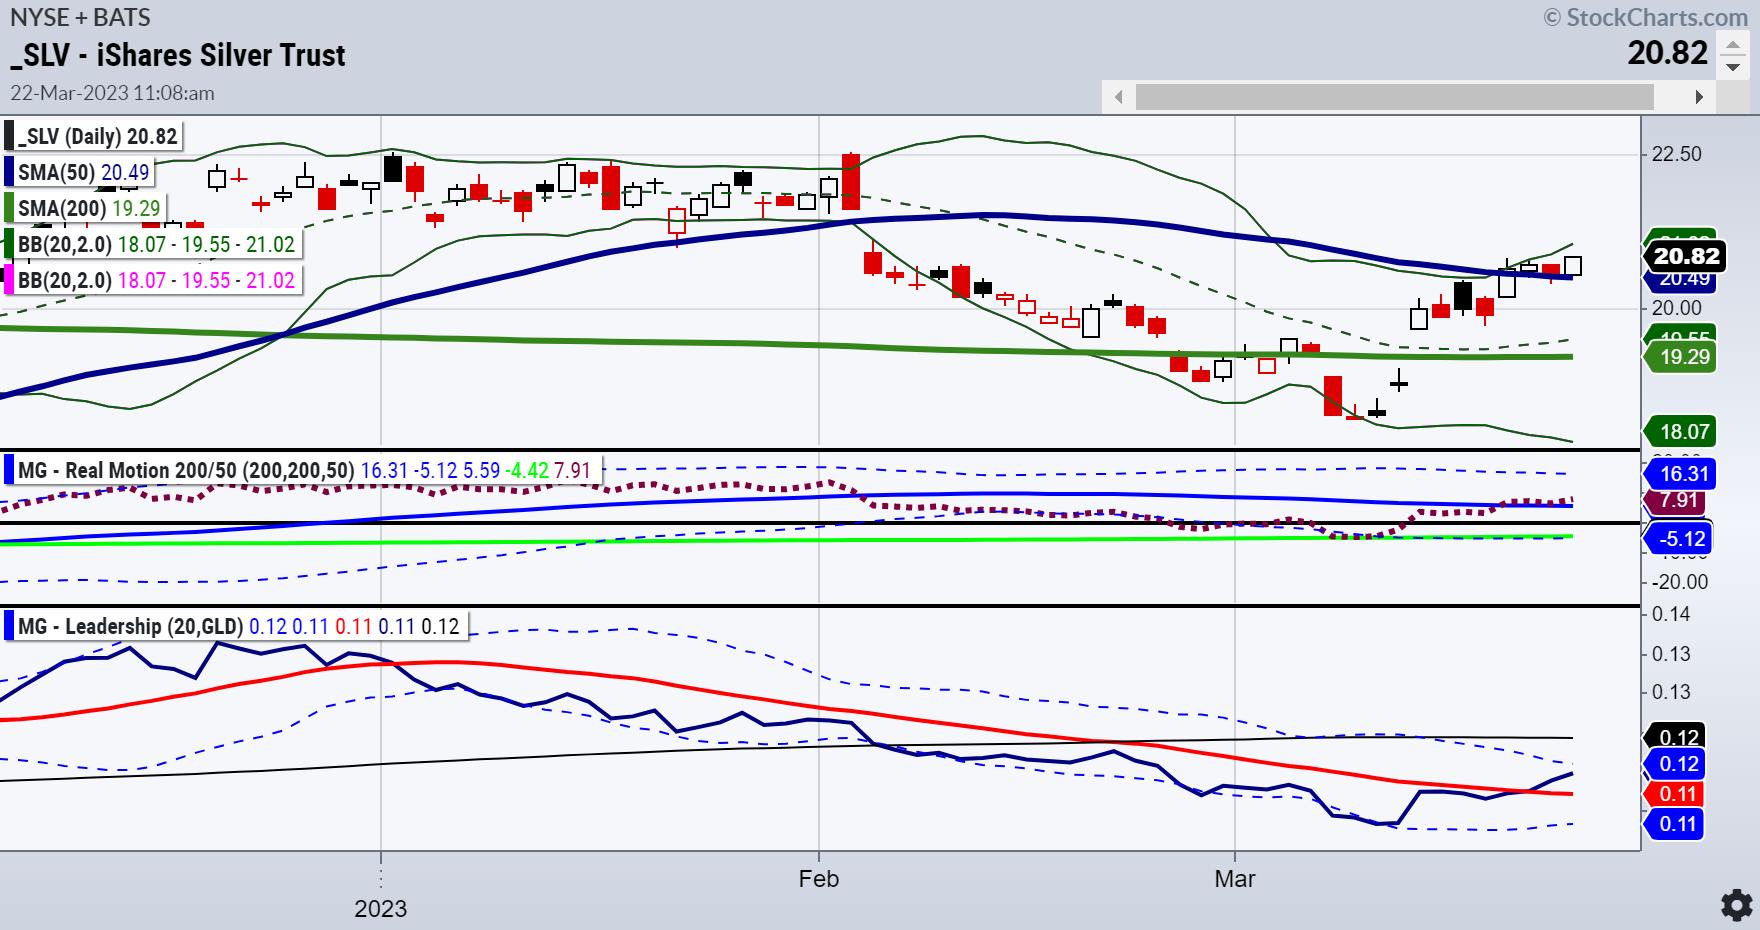
CHART 1: SILVER PRICES MOVING HIGHER. The MG Leadership indicator is showing that silver is outperforming gold which could mean an inflationary environment. Chart source: StockChartsACP. For illustrative purposes only.
The Federal Reserve raised rates by 25 basis points. The decision was unanimous. The terminal rate projection is unchanged at 5.1%.
The FOMC statement modifies guidance: "The committee anticipates that some additional policy firming may be appropriate."
My first tweet @marketminute this morning before the market opened:
@marketminute: I feel pretty certain Powell goes 25. Announces they're willing to keep raising at that rate as jobs strong, economy ok & banks aren't in a credit crisis. However, as data dependent, they could change course accordingly. $SPY remains in a trading range. Until the next fracture appears
And then there's $sugar looking like it's about to continue the rally higher. Food prices will remain elevated. And the Fed remains stuck between the damage done but the root of inflation far from fixed."
My tweeted response after the FOMC?
@marketminute: 5% yields create more stress to labor market.
Does nothing for rising food prices and global inflation.
Silver is outperforming gold.
Sounds like Stagflation
The daily chart of silver shows the price rising further away from the 50-day moving average in blue. The Leadership indicator shows that silver is beginning to outperform gold. That, in and of itself, is highly inflationary.
The initial response in the indexes was to buy, as investors only hear "pivot."
Powell: "Intermeeting data on jobs and inflation came in stronger than expected. We considered pause, but the hike was supported by strong consensus."
You hear pivot? I hear considered—quite different. This is why it is important not only to watch how silver performs relative to gold but also how bonds perform relative to the S&P 500.
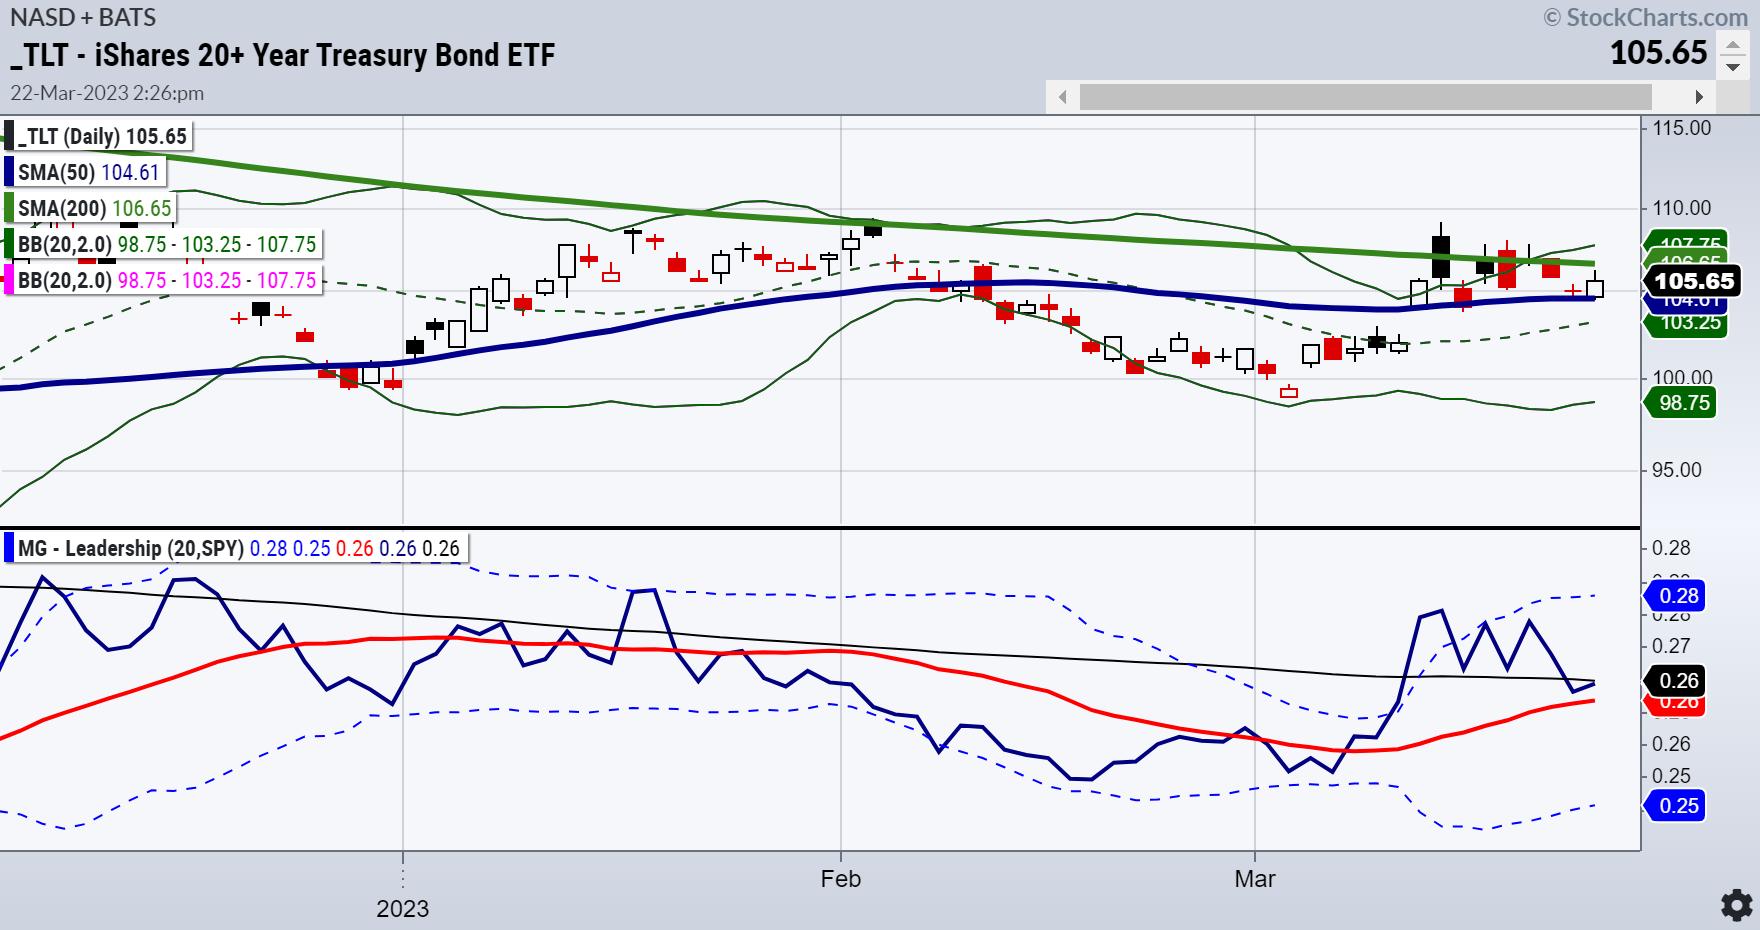
CHART 2: BONDS VS. STOCKS. Long bonds are outperforming the S&P 500 index, which is typically recessionary. Chart source: StockChartsACP. For illustrative purposes only.
Long bonds are outperforming the S&P 500. The Daily from March 12covers this potential in detail. That is typically recessionary.
So, if you add up rising gold, silver, cocoa, sugar, copper, steel, and maybe oil prices, along with long bonds showing yields might have topped and, then add that the bonds are doing better than the market (SPY)—that equals Stagflation.
But the real issue is we have not seen the full impact of the Fed and central banks losing control. And the US dollar is weak.
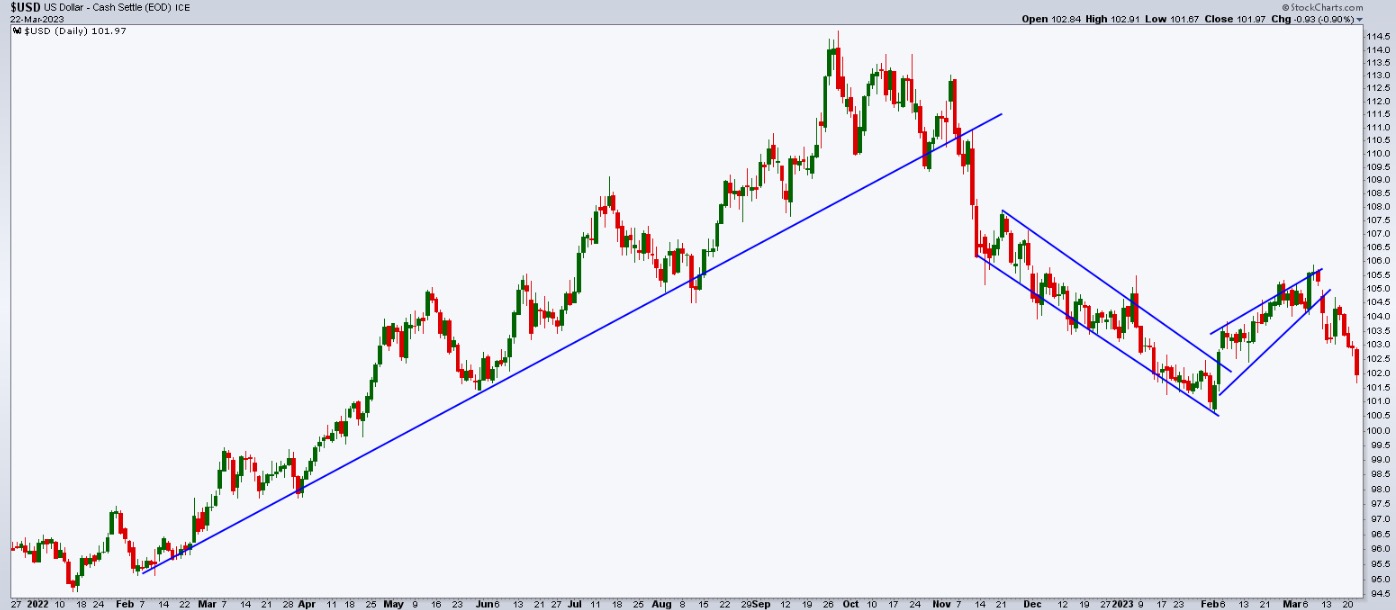
CHART 3: US DOLLAR DECLINING. Do we have what it takes for potential stagflation? Something to watch for. Chart source: StockChartsACP. For illustrative purposes only.
A perfect storm? Something to keep an eye on.
For more detailed trading information about our blended models, tools and trader education courses, contact Rob Quinn, our Chief Strategy Consultant, to learn more.
IT'S NOT TOO LATE! Click here if you'd like a complimentary copy of Mish's 2023 Market Outlook E-Book in your inbox.


"I grew my money tree and so can you!" - Mish Schneider
Get your copy of Plant Your Money Tree: A Guide to Growing Your Wealth and a special bonus here.
Follow Mish on Twitter @marketminute for stock picks and more. Follow Mish on Instagram (mishschneider) for daily morning videos. To see updated media clips, click here.
Mish in the Media
Mish sits down with Kristen on Cheddar TV's closing bell to talk what Gold is saying and more.
Mish and Dave Keller of StockCharts look at longer term charts and discuss action plans on the Thursday, March 17 edition of StockCharts TV's The Final Bar.
Mish covers current market conditions strengths and weaknesses in this appearance on CMC Markets.
Mish sees opportunity in Vietnam, is trading SPX as a range, and likes semiconductors, as she explains to Dale Pinkert on ForexAnalytix's F.A.C.E. webinar.
Mish and Nicole discuss specific stock recommendations and Fed expectations on TD Ameritrade.
Coming Up:
March 24th: Opening Bell with BNN Bloomberg
March 30th: Your Daily Five, StockCharts TV
March 31st: Festival of Learning Real Vision "Portfolio Doctor"
April 24-26: Mish at The Money Show in Las Vegas
May 2-5: StockCharts TV Market Outlook
ETF Summary
- S&P 500 (SPY): 400 pierced for a minute, now back to resistance; 390 pivotal.
- Russell 2000 (IWM): 170-180 range now.
- Dow (DIA): Could not hold the move over 324, the 200-DMA.
- Nasdaq (QQQ): 328 is the 23-month MA resistance, now a bit overbought on the indicators.
- Regional Banks (KRE): 44 support, 50 resistance.
- Semiconductors (SMH): Will watch for a key reversal to the mean w/ 250 support.
- Transportation (IYT): Holding the 200-WMA 219, but has to clear the 200-DMA at 224.
- Biotechnology (IBB): 127.50 resistance.
- Retail (XRT): 60 big support and 64 big resistance.
Mish Schneider
MarketGauge.com
Director of Trading Research and Education


