Last week, I tweeted:
I believe the #commodities prices in food softs $DBA have bottomed. $GLD-well those who know me-that I pointed out bottomed months ago. $SLV now outperforming. That tells you something. Maybe even #oil. Get ready for the Commodities Super Cycle.
If you are not following me @marketminute on twitter, you should consider doing so, as I often make such comments or point out specific trades.
Technically, the charts were already setting up for a buy in the individual grains. We decided to focus on DBA.
Fundamentally, we have geopolitical issues, as we know. I also talk about sugar, which still rocketing in price, a lot. Now weather is becoming an additional factor. I read today that Russia is refusing to sell wheat below $275 a ton, which, combined with failing HRW wheat in the plains and Southwest US and heavy snowpack in the northern plains, means supply could get even tighter.
DBA tracks an index of 10 agricultural commodity futures contracts. It selects contracts based on the shape of the futures curve to minimize contango. Specifically, the underlying index includes corn, soybeans, wheat, Kansas City wheat, sugar, cocoa, coffee, cotton, live cattle, feeder cattle, and lean hogs. And there is a K-1 to investors.
Basically, you get great exposure to lots of commodities.
Technical Analysis:
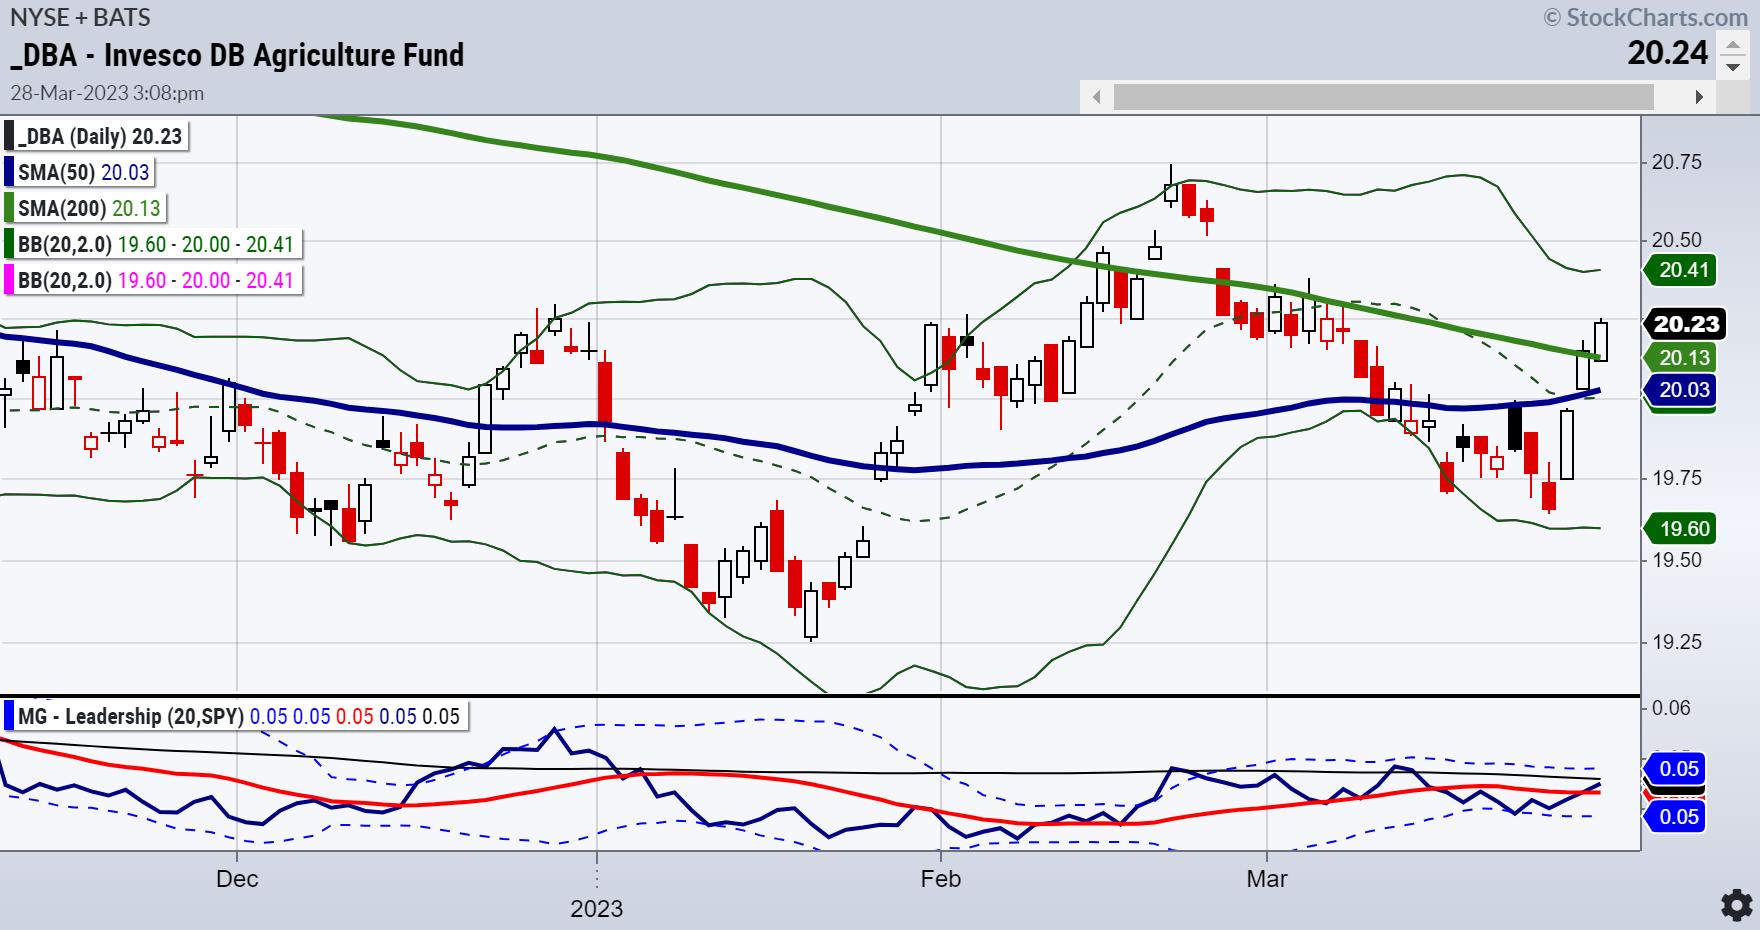
The first chart shows the Triple Play Leadership indicator, or how DBA is performing against the benchmark.
The price chart of DBA shows the 200-DMA above the 50-DMA, or an accumulation phase according to our six market phases. On Tuesday, the price cleared the 200-DMA, closing .40% higher. On the Leadership charts, DBA poke its head out above the benchmark to show it is now outperforming the SPY.
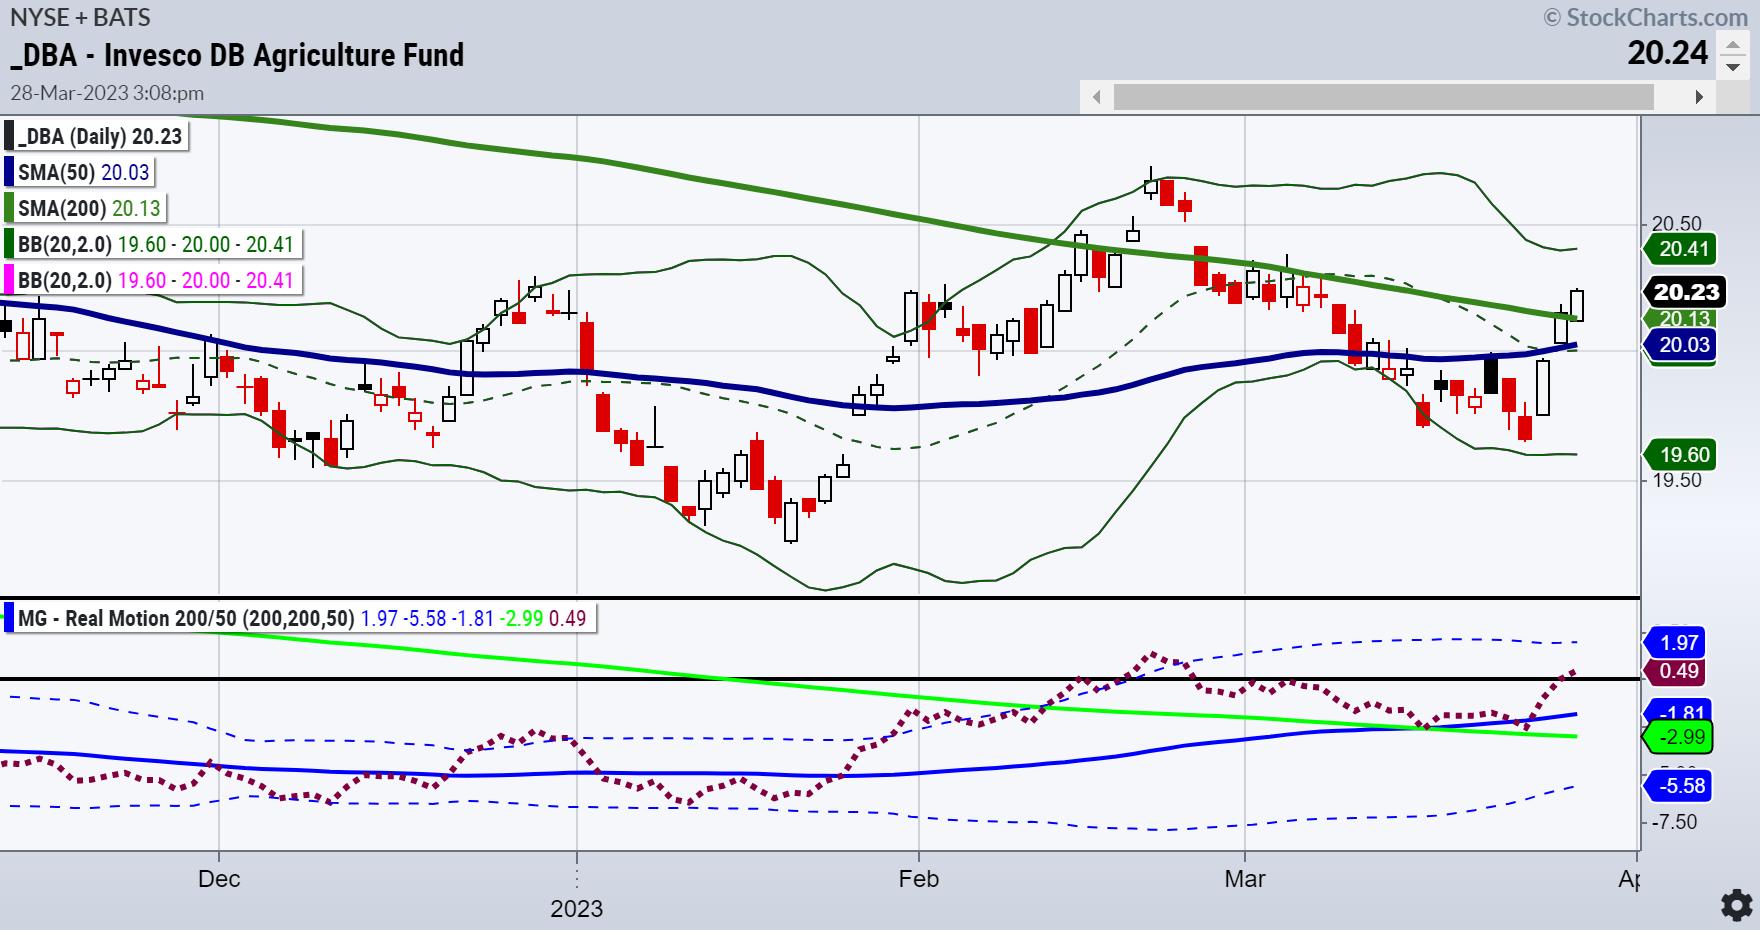
The second chart shows our Real Motion Indicator or momentum. Here's where things get real interesting.
The 50-DMA is ABOVE the 200-DMA. Momentum is in a bullish phase. Furthermore, the red-dotted line, or measure of momentum, cleared both MAs and the black horizontal line or zero point. Bullish momentum and a divergence with the price chart showing the 50-DMA below the 200-DMA.
What does this all mean? Seasonally, we are entering the make-or-break time for crops. Inflation-wise, food prices continue to escalate. In the U.K., grocery inflation rose again in March to a record 17.5%.
Disclaimer: We have a position.
For more detailed trading information about our blended models, tools and trader education courses, contact Rob Quinn, our Chief Strategy Consultant, to learn more.
IT'S NOT TOO LATE! Click here if you'd like a complimentary copy of Mish's 2023 Market Outlook E-Book in your inbox.


"I grew my money tree and so can you!" - Mish Schneider
Get your copy of Plant Your Money Tree: A Guide to Growing Your Wealth and a special bonus here.
Follow Mish on Twitter @marketminute for stock picks and more. Follow Mish on Instagram (mishschneider) for daily morning videos. To see updated media clips, click here.
Mish in the Media
Mish talks looking for stock market opportunities on Business First AM.
Mish discusses long bonds, Silver to Gold and the Dollar in this appearance on BNN Bloomberg.
Mish sits down with Kristen on Cheddar TV's closing bell to talk what Gold is saying and more.
Mish and Dave Keller of StockCharts look at longer term charts and discuss action plans on the Thursday, March 17 edition of StockCharts TV's The Final Bar.
Mish covers current market conditions strengths and weaknesses in this appearance on CMC Markets.
Mish sees opportunity in Vietnam, is trading SPX as a range, and likes semiconductors, as she explains to Dale Pinkert on ForexAnalytix's F.A.C.E. webinar.
Mish and Nicole discuss specific stock recommendations and Fed expectations on TD Ameritrade.
Coming Up:
March 30th: Your Daily Five, StockCharts TV
March 31st: Festival of Learning Real Vision "Portfolio Doctor"
April 4th: The RoShowPod with Rosanna Prestia
April 24-26: Mish at The Money Show in Las Vegas
May 2-5: StockCharts TV Market Outlook
ETF Summary
- S&P 500 (SPY): Needs to clear 400 and hold 390
- Russell 2000 (IWM): 170 held- 180 resistance
- Dow (DIA): 325 could not hold-pivotal
- Nasdaq (QQQ): 305 support 320 resistance
- Regional Banks (KRE): Weekly price action more inside the range of the last 2 weeks
- Semiconductors (SMH): Follow through on that key reversal lower w/ 250 support
- Transportation (IYT): 219 is a level that has been like a yo-yo price
- Biotechnology (IBB): Held key support at 125 area-127.50 resistance
- Retail (XRT): Granny holding 60-still in the game-especially since that is the January calendar range low.
Mish Schneider
MarketGauge.com
Director of Trading Research and Education


