Earnings season is often filled with big gaps, and it's easy to look at them as big opportunities to catch a big move quickly. However, it's also easy to get burned by entering trades right before the earnings announcement.
We have a different way to use earnings announcements with big moves to help give you an edge in your trading. If you're looking to make a quick buck, this isn't for you. If you're looking for a way to be on the right side of a multi-week or monthly trend, this can help.
This method doesn't enter a trade before the gap, so you're not going take that risk or get that thrill (depending on your perspective). If you want to trade the action on the day the market reacts to the news, you can do that with controlled risk using Opening Range strategies, but this article isn't going to focus on that either.
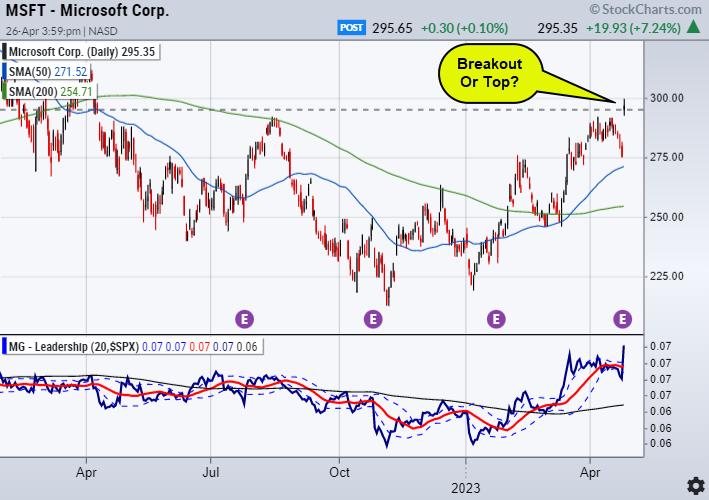
There are plenty of slower paced big trend trades the use earnings news, but don't require you to trade on the day of the earnings announcement. The chart above is of Microsoft (MSFT)'s big gap today. The news is out, and the market has spent the day digesting it. Still, the chart begs the question: "Should I buy this momentum breakout or expect it to be a top?"
The simple answer is... it depends.
Earnings announcements focus investors' attention on a price level, generate a lot of trading, and often provide new information that can change the demand for a stock. As a result, the day or two in which the market reacts to the news creates a range that is often very reliable support and resistance for months.
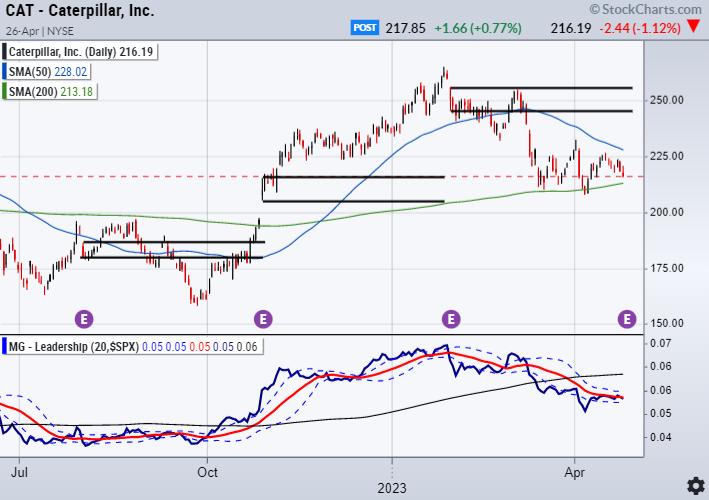
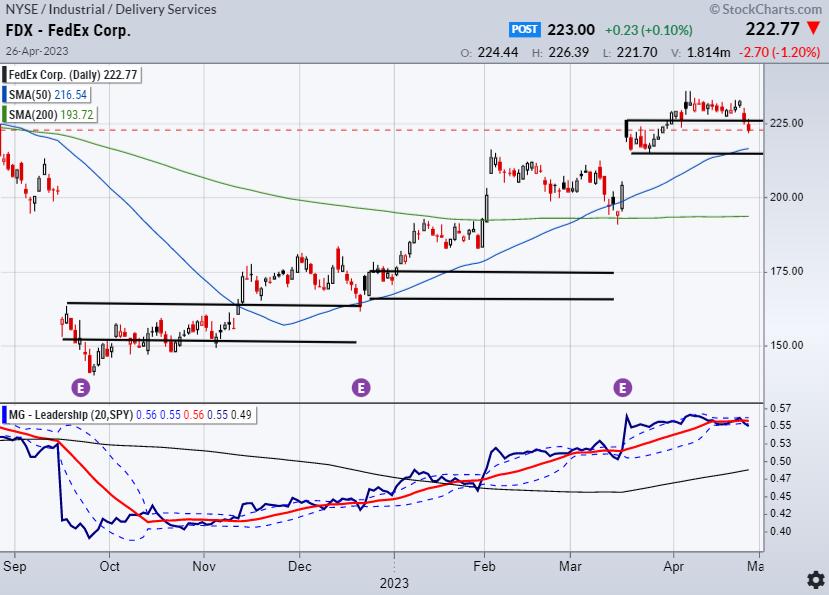
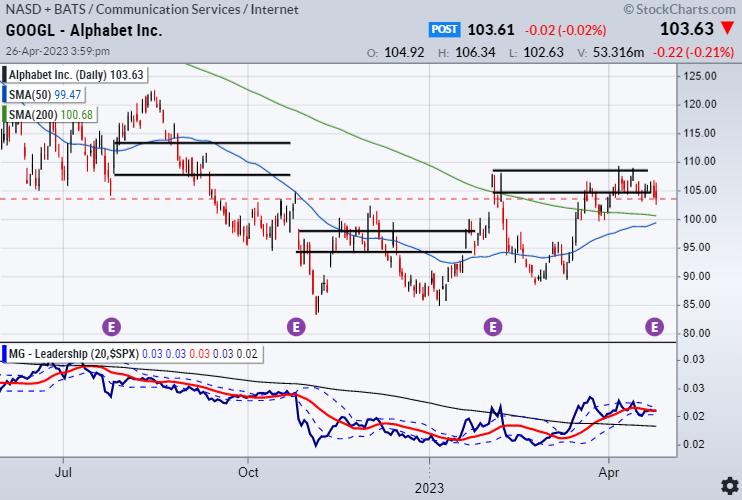
In the charts below, you'll see lines drawn to represent the range of the day or two in which the market reacted to earnings. StockCharts make identifying the last several earnings days easy by marking them with the "E" icon near the bottom of all the charts.
If you consider the stock to be in a bullish mode when it's over the most recent earnings day range, and in a bearish mode when it's under, you'll see that these levels provide valuable inflection points for breakouts and support or resistance levels for reversals.
For example, look at MSFT below. Even if you consider the fact that MSFT did follow the general trend of the market during this time frame, the levels defined frequently determine levels of important support and resistance.
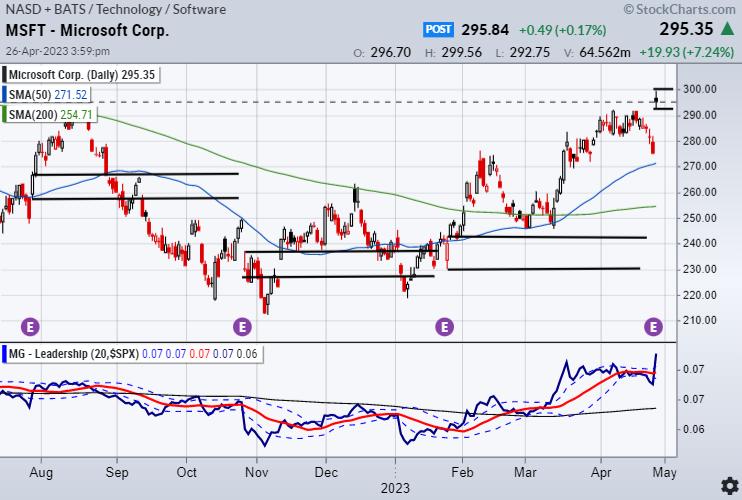
You'll find that these levels will often identify stocks that will trend counter to the general market.
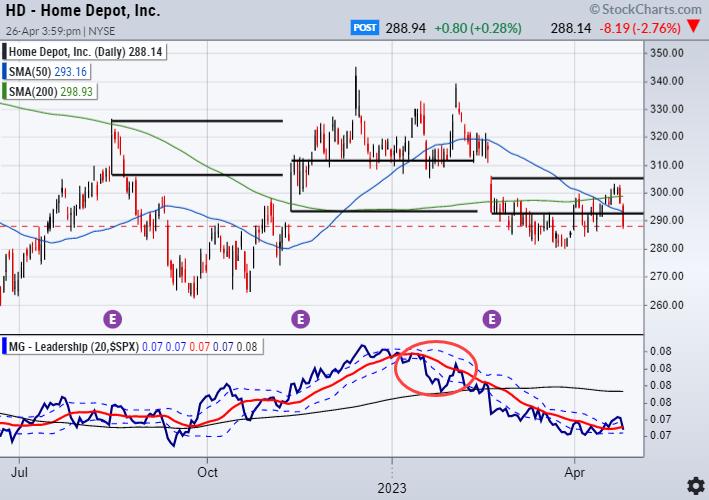
For example, the general market has been in a bullish trend in 2023, but Home Depot (HD) gapped down on earnings on February 21st and then moved lower than its range. It struggled to get back over the low of the range and never exceeded the high. It also has another pattern which is bearish. Its earnings ranges are "stepping down."

Make It More Powerful With A Confirming Indicator
As with most good indicators, a complimentary confirmation indicator can make it better.
An effective confirmation indicator to the earnings range is the MarketGauge Leadership line (MG Leadership). When the blue line is over the red line in this indicator, it is bullish, because it indicates that the stock has more strength than the market.
When MG Leadership is bullish (blue line over the red line), this implies that if a stock is trending higher, it's not just being pulled up by a bullish trend in the market.
The best bullish condition is when a stock is over the earnings range high and has bullish MG Leadership.
If you look at HD above, you'll see a red circle identifying the period when HD was trading over its earnings range high, but MG Leadership was bearish. It's no surprise that the stock didn't move higher and ultimately fell.
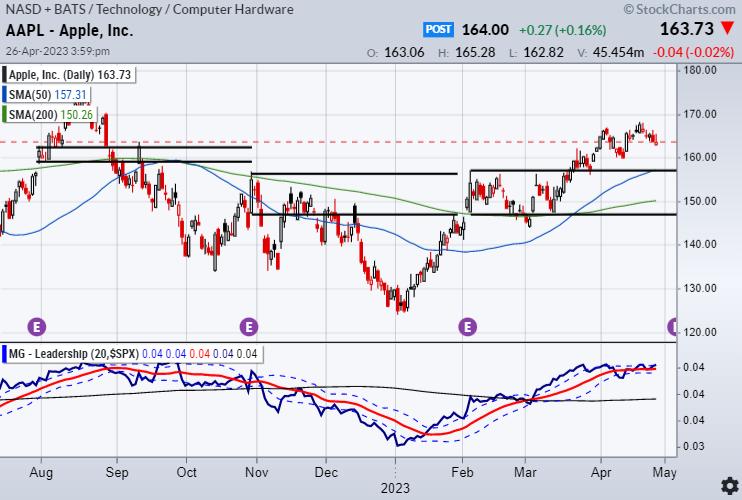
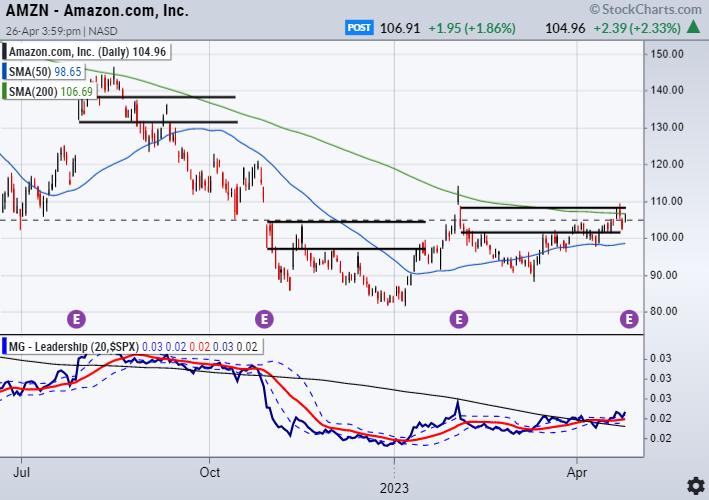
Below you'll find several charts with the earnings ranges marked.
There are several patterns that repeat around these ranges. If you trade the Opening Range or have studied trading ranges in this way, you'll spot them quickly. If this is a new concept to you, it will become more insightful as you look at more ranges.
Now is a great time to be looking for earning ranges that line up with other important levels.
MSFT is a good example. Breakout or a head fake top? It depends on which way it goes next! Follow the range break.
Here are some examples worth reviewing.
For more detailed trading information about our blended models, tools and trader education courses, contact Rob Quinn, our Chief Strategy Consultant, to learn more.
IT'S NOT TOO LATE! Click here if you'd like a complimentary copy of Mish's 2023 Market Outlook E-Book in your inbox.


"I grew my money tree and so can you!" - Mish Schneider
Get your copy of Plant Your Money Tree: A Guide to Growing Your Wealth and a special bonus here.
Follow Mish on Twitter @marketminute for stock picks and more. Follow Mish on Instagram (mishschneider) for daily morning videos. To see updated media clips, click here.
Mish in the Media
Mish and Benzinga discuss the current trading ranges and what might break them.
Mish discusses what she'll be talking about at The Money Show, from April 24-26!
Mish walks you through technical analysis of TSLA and market conditions and presents an action plan on CMC Markets.
Mish presents two stocks to look at in this appearance on Business First AM -- one bullish, one bearish.
Mish joins David Keller on the Thursday, May 13 edition of StockCharts TV's The Final Bar, where she shares her charts of high yield bonds, semiconductors, gold, and regional banks.
Mish joins Wolf Financial for this Twitter Spaces event, where she and others discuss their experiences as former pit traders.
Mish shares her views on natural gas, crude oil and a selection of ETFs in this appearance on CMC Markets.
Mish talks what's next for the economy on Yahoo! Finance.
Mish joins Bob Lang of Explosive Options for a special webinar on what traders can expect in 2023!
Rosanna Prestia of The RO Show chats with Mish about commodities, macro and markets.
Mish and Charles Payne rip through lots of stock picks in this appearance on Fox Business' Making Money with Charles Payne.
Coming Up:
April 28th: Live Coaching Complete Trader and TD Ameritrade with Nicole Petallides
May 2nd-5th: StockCharts TV Market Outlook
ETF Summary
- S&P 500 (SPY): The new range to watch is 405; 410 on a closing basis.
- Russell 2000 (IWM): 170 support, 180 resistance.
- Dow (DIA): Over the 23-month MA 333-support to hold.
- Nasdaq (QQQ): 306 support, over 320 better.
- Regional banks (KRE): 44 now pivotal resistance.
- Semiconductors (SMH): 245 resistance with support at 235.
- Transportation (IYT): Still under the 23-month MA with 224 resistance; 215 is Real Motion support.
- Biotechnology (IBB): 130 major pivotal area-135 resistance.
- Retail (XRT): 58-64 trading range to break one way or another.
Geoff Bysshe
MarketGauge.com
President