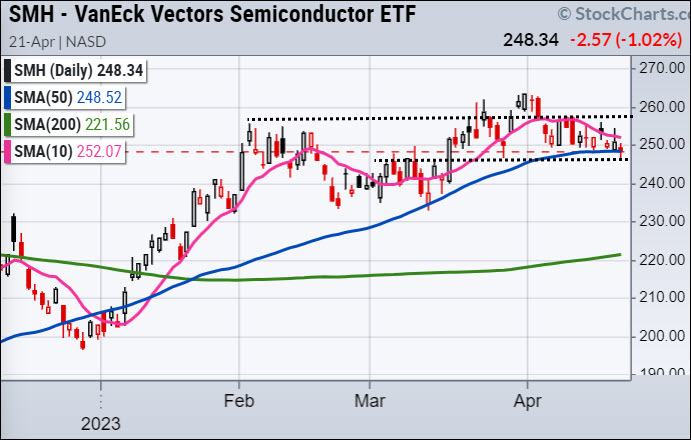
Heads up, you wouldn't know it by looking at its daily chart, but the SMH is skating on some very thin ice.
Since the market's lows in October 2022, the SMH has been one of the recent bull rally's earliest and most influential supporters, but the same indicators that led its turn up last Fall have turned down this Spring. This is potentially bad news for the uptrend in SMH and the general market trend. While it looks like the SMH is sitting comfortably on its 50-DMA, there are indications it may break, and, if it does, these indicators suggest it won't come right back.
Looking at the chart below, you'll see the daily chart of the SMH sitting on its 50-DMA with three indicators below it – MG Leadership, MG Real Motion 50/200, and MG Real Motion 10/50. If you're familiar with these indicators, the circles and arrows should tell you the whole story.
If you're new to the MarketGauge indicators...
The simplest form of analysis is that the green circles indicate a bullish change, the red circles indicate a bearish change, and as a result, the price trend should continue in the indicated direction. The easiest way to measure a meaningful continuation or change in the price trend's direction is a break of the 50- or 200-DMA, as indicated by the arrows.
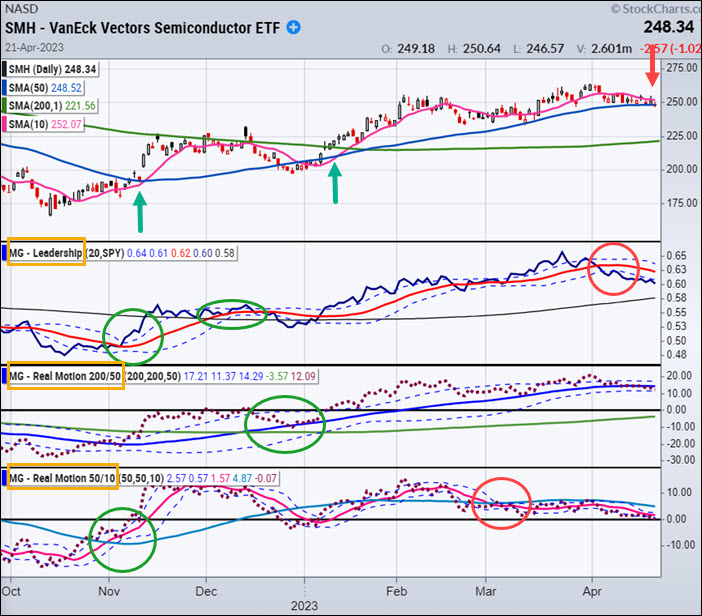
The summary is that Leadership turned bearish in early April and MG Real Motion, which is a momentum indicator, has been diverging in a bearish way since early March. This divergence became more bearish when SMH made a new high, while RM 10/50 was not able to trade higher than its 50-DMA. This is a big warning sign in Real Motion. As a result, the bearish inflection point is a clear break of the 50-DMA in price.
If the 50-DMA breaks, it's likely to continue to slide until Real Motion and/or Leadership show a bullish posture.
It is possible for SMH to avoid breaking the 50-DMA and resume its uptrend; if that happens in a reliable way, then Leadership should turn up (blue over red) and RM 10/50 dots should trade over its blue moving average. Until then, SMH is skating on very thin ice.
For more detailed trading information about our blended models, tools and trader education courses, contact Rob Quinn, our Chief Strategy Consultant, to learn more.
IT'S NOT TOO LATE! Click here if you'd like a complimentary copy of Mish's 2023 Market Outlook E-Book in your inbox.


"I grew my money tree and so can you!" - Mish Schneider
Get your copy of Plant Your Money Tree: A Guide to Growing Your Wealth and a special bonus here.
Follow Mish on Twitter @marketminute for stock picks and more. Follow Mish on Instagram (mishschneider) for daily morning videos. To see updated media clips, click here.
Mish in the Media
Mish and Benzinga discuss the current trading ranges and what might break them.
Mish discusses what she'll be talking about at The Money Show, from April 24-26!
Mish walks you through technical analysis of TSLA and market conditions and presents an action plan on CMC Markets.
Mish presents two stocks to look at in this appearance on Business First AM -- one bullish, one bearish.
Mish joins David Keller on the Thursday, May 13 edition of StockCharts TV's The Final Bar, where she shares her charts of high yield bonds, semiconductors, gold, and regional banks.
Mish joins Wolf Financial for this Twitter Spaces event, where she and others discuss their experiences as former pit traders.
Mish shares her views on natural gas, crude oil and a selection of ETFs in this appearance on CMC Markets.
Mish talks what's next for the economy on Yahoo! Finance.
Mish joins Bob Lang of Explosive Options for a special webinar on what traders can expect in 2023!
Rosanna Prestia of The RO Show chats with Mish about commodities, macro and markets.
Mish and Charles Payne rip through lots of stock picks in this appearance on Fox Business' Making Money with Charles Payne.
Coming Up:
April 24-26th: Mish at The Money Show in Las Vegas -- two presentations and a book giveaway
April 28th: Live Coaching Complete Trader and TD Ameritrade with Nicole Petallides
May 2nd-5th: StockCharts TV Market Outlook
ETF Summary
- S&P 500 (SPY): Tight range to watch this week; 410-415 on a closing basis.
- Russell 2000 (IWM): 170 support, 180 resistance.
- Dow (DIA): Over the 23-month MA 336--support to hold.
- Nasdaq (QQQ): 312 support, over 320 better.
- Regional banks (KRE): 44 now pivotal resistance.
- Semiconductors (SMH): 258 resistance with support at 246.
- Transportation (IYT): Still under the 23-month MA with 232 resistance, 224 support.
- Biotechnology (IBB): 130 major pivotal area--135 resistance.
- Retail (XRT): 58-64 trading range to break one way or another.
Geoff Bysshe
MarketGauge.com
President