Since the first quarter ended with very few instruments above the 23-month, we thought we would start the 2nd quarter by examining where the 4 indices are.
Over the weekend, the Market Outlook reminded us that "we would likely see a rangebound market, along with stagflation. With positive back-to-back quarterly returns since the beginning of the 4th quarter, 2022 bodes well for stocks.
"April seasonality trends suggest the buying pressure could continue. Since 1950, the S&P has posted average and median April returns of 1.5% and 1.2%, respectively. In addition, the index (S&P 500) has finished positive during the month 71% of the time, marking the highest positivity rate on the calendar."
This is why we really find the 23-month moving average, or about a 2-year business cycle, to be so important and quite possibly the most important indicator for this next quarter.
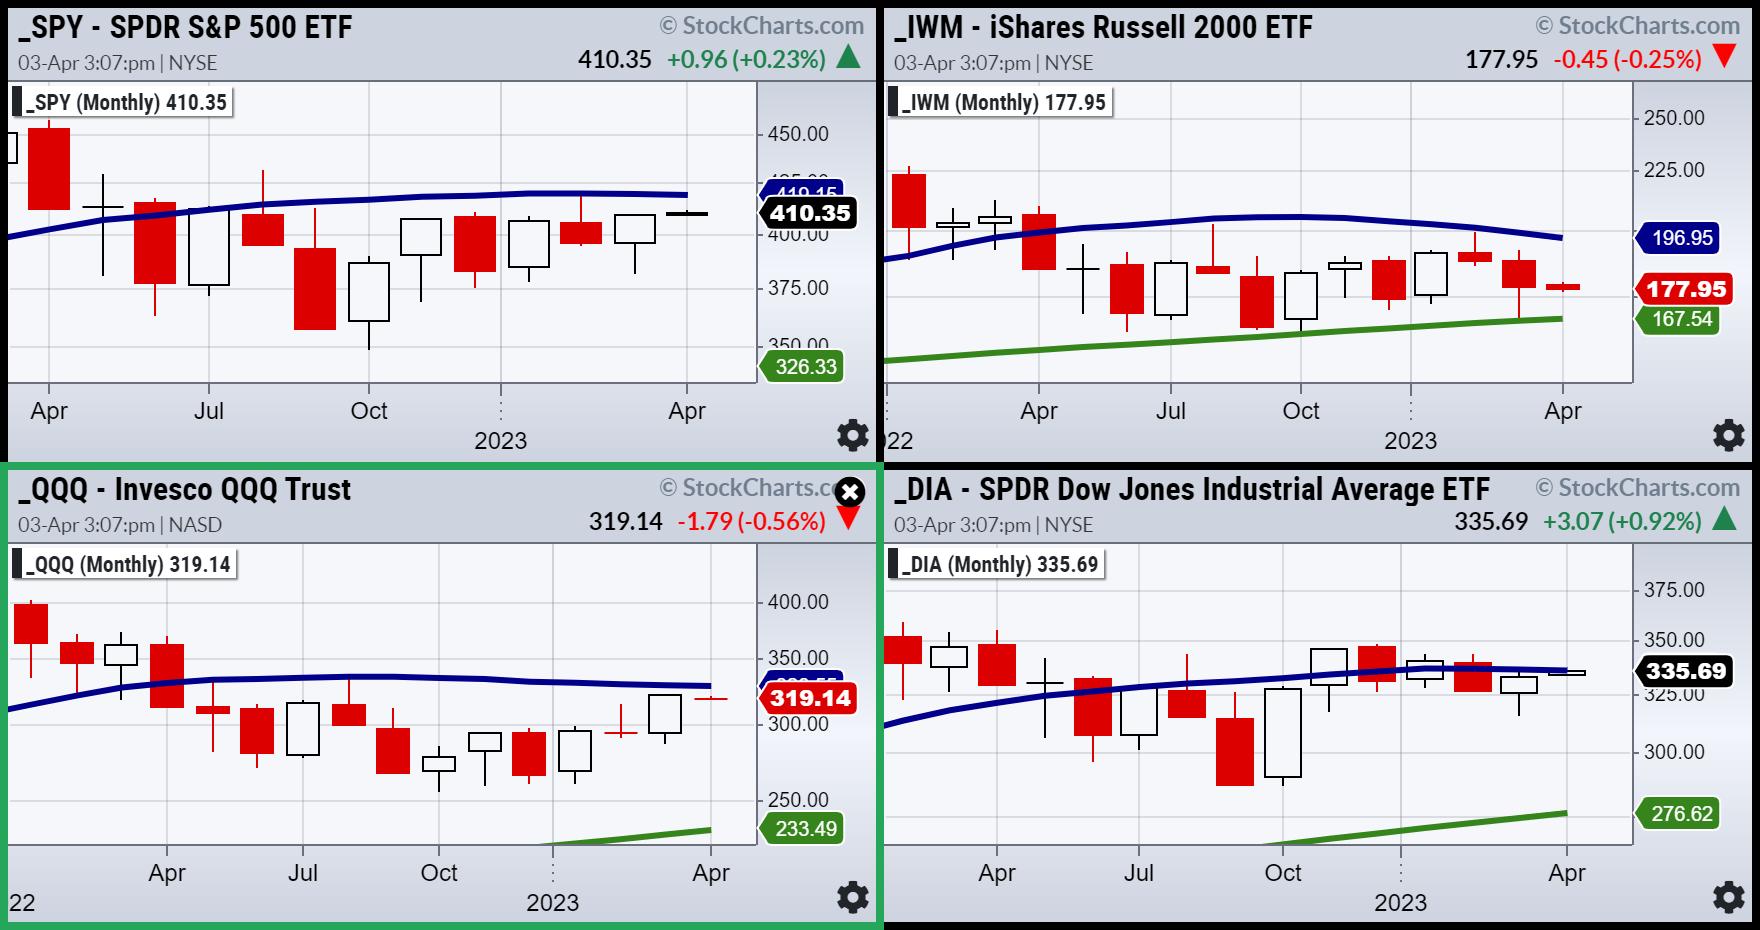
Looking at the four charts of the four major indices, you can see that all their prices are starting April under the 23-month moving average. Is this significant? Yes, because after a bullish 2021 and a bearish 2022, 2023 is rangebound and unclear yet whether the market believes the economy will expand.
One thing is certain--2023 remains a bit murky, as there is contraction in economic statistics, such as the ISM manufacturing number, yet higher inflation potential with the OPEC+ decision to cut oil production further.
The FED is in the same pickle this quarter as they were in the last one. Maybe worse.
The index closest to breaking out over the 23-month is the Dow. And that makes sense.
Industrials are strong even in an inflationary environment as they have pricing power.
The next index that could breakout is NASDAQ. And that, too, makes sense. If the Fed pauses, growth stocks can continue what semiconductor stocks started in March.
The S&P 500 is also close. However, if inflation continues, regardless of what the Fed does or does not do, these companies or the top Fortune 500 can continue to struggle.
The small caps hurt the most. And that too makes sense. Hence, our eyes are here for best clues. Look to a year ago in April 2022. The NASDAQ fell below the 23-month MA first, then the small caps and then the rest followed. Now, we will watch for the opposite.
Which index (if any) clears the MA first?
For more detailed trading information about our blended models, tools and trader education courses, contact Rob Quinn, our Chief Strategy Consultant, to learn more.
IT'S NOT TOO LATE! Click here if you'd like a complimentary copy of Mish's 2023 Market Outlook E-Book in your inbox.


"I grew my money tree and so can you!" - Mish Schneider
Get your copy of Plant Your Money Tree: A Guide to Growing Your Wealth and a special bonus here.
Follow Mish on Twitter @marketminute for stock picks and more. Follow Mish on Instagram (mishschneider) for daily morning videos. To see updated media clips, click here.
Mish in the Media
Mish chats with Neils Christensen on Oil and Gold in this article from Kitco.
See Mish's presentation at Real Vision's Festival of Learning, exclusively available for Real Vision members.
Mish talks with CNBC Asia about hope, fear, and greed, and what could happen going forward.
On the Thursday edition of StockCharts TV's Your Daily Five, Mish walks you through where we are in the economic cycle at the end of the first quarter, then highlights what to look for (and trade) as we enter the second quarter.
In this appearance on CMC Markets, Mish gives you clear actionable information to support why commodities look to go higher from here.
Mish talks looking for stock market opportunities on Business First AM.
Mish discusses long bonds, Silver to Gold and the Dollar in this appearance on BNN Bloomberg.
Mish sits down with Kristen on Cheddar TV's closing bell to talk what Gold is saying and more.
Mish and Dave Keller of StockCharts look at longer term charts and discuss action plans on the Thursday, March 17 edition of StockCharts TV's The Final Bar.
Mish covers current market conditions strengths and weaknesses in this appearance on CMC Markets.
Mish sees opportunity in Vietnam, is trading SPX as a range, and likes semiconductors, as she explains to Dale Pinkert on ForexAnalytix's F.A.C.E. webinar.
Mish and Nicole discuss specific stock recommendations and Fed expectations on TD Ameritrade.
Hear Mish chat with Loren Hodi on the Bitcoin Talk podcast!
Coming Up:
April 4th:Making Money with Charles Payne on Fox Business AND The RoShowPod with Rosanna Prestia
April 13th:The Final Bar with David Keller on StockCharts TV
April 24-26: Mish at The Money Show in Las Vegas
May 2-5: StockCharts TV Market Outlook
ETF Summary
- S&P 500 (SPY): 405 support and 410 pivotal.
- Russell 2000 (IWM): 170 support- 180 resistance still.
- Dow (DIA): Confirmed bullish phase.
- Nasdaq (QQQ): 325 the 23-month moving average-huge.
- Regional Banks (KRE): Weekly price action more inside the range of the last 3 weeks-still looks weak.
- Semiconductors (SMH): 255 key support 270 resistance.
- Transportation (IYT): 225 a weekly support level and 223 a daily support level.
- Biotechnology (IBB): Needs to clear the 130 area.
- Retail (XRT): Big resistance at 64.
Mish Schneider
MarketGauge.com
Director of Trading Research and Education


