USO, the US Oil Fund ETF, invests primarily in futures contracts for light, sweet crude oil, other types of crude oil, diesel-heating oil, gasoline, natural gas, and other petroleum-based fuels. Essentially, the top 6 holdings are crude oil futures from May to August--which, like futures, will continue to roll out and into the next month as contract months expire.
The month of May has seen a tremendous about of ouflow of funds in US oil. YTD total return for investors is -11.47%.
Energy, gas and oil are the underperformers this year and a main reason many call for deflation, recession or at the very least, end of accelerating inflation. What we do know as commodities traders, though, is that there are emerging trends, existing trends and trends that are on vacation (which could last months or years).
Which trend is US Oil in?
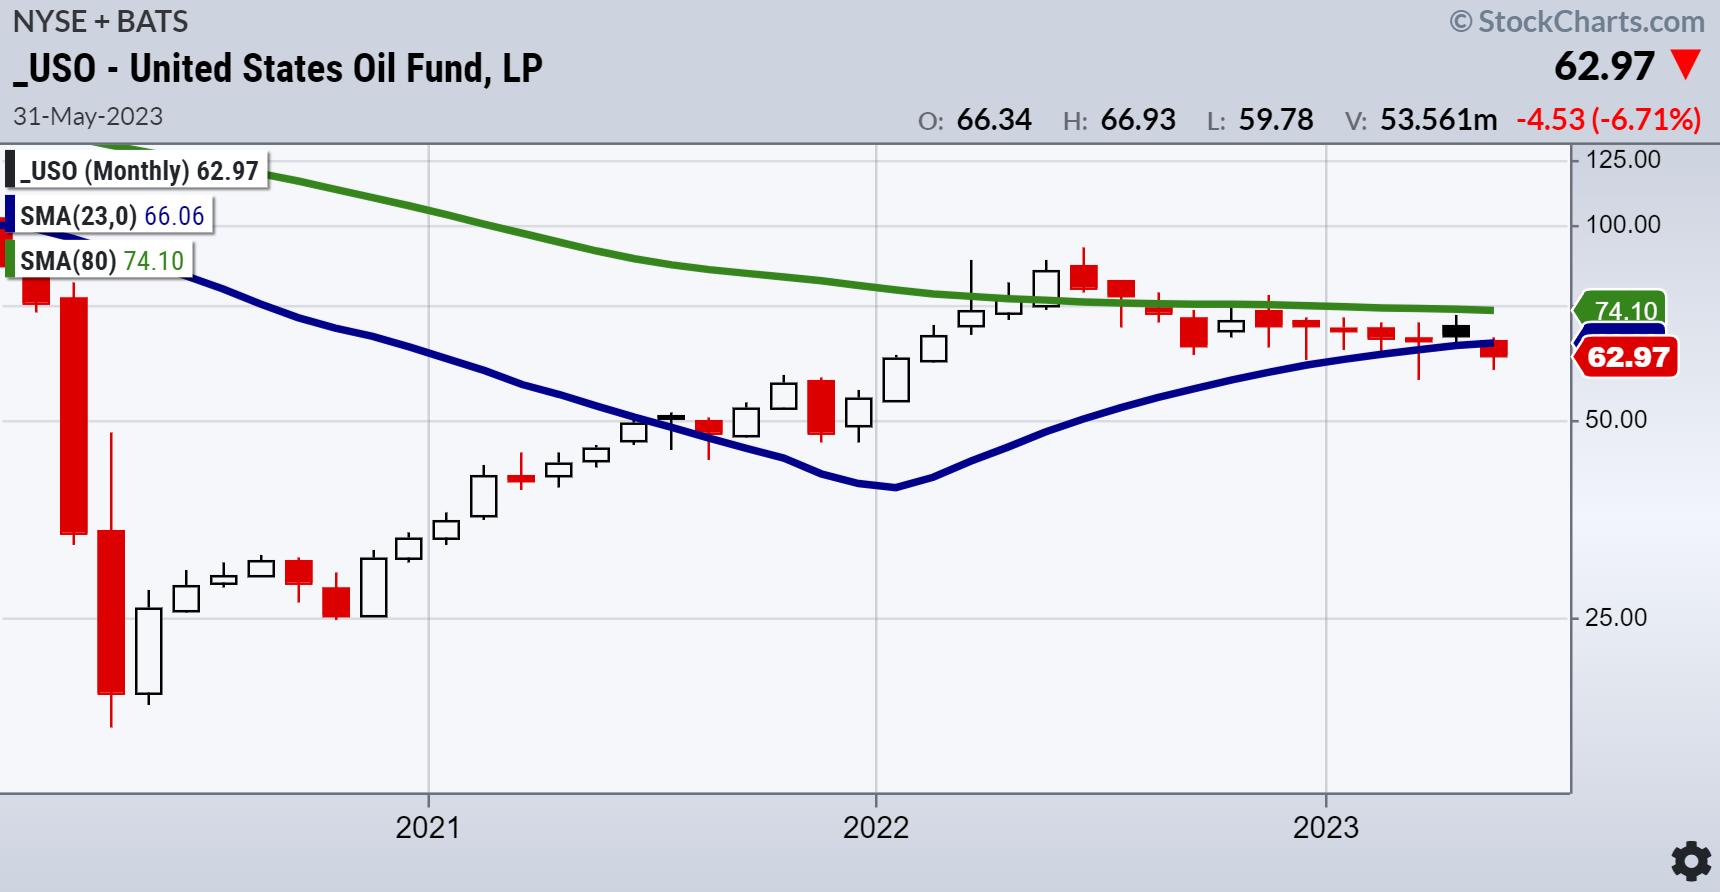
On a monthly chart, USO is not stacked, as I have shown you with other sectors. In other words, the 23-month moving average sits under the 80-month MA. That tells us that, even in 2022 when the price was over both MAs, the phase never really turned bullish.
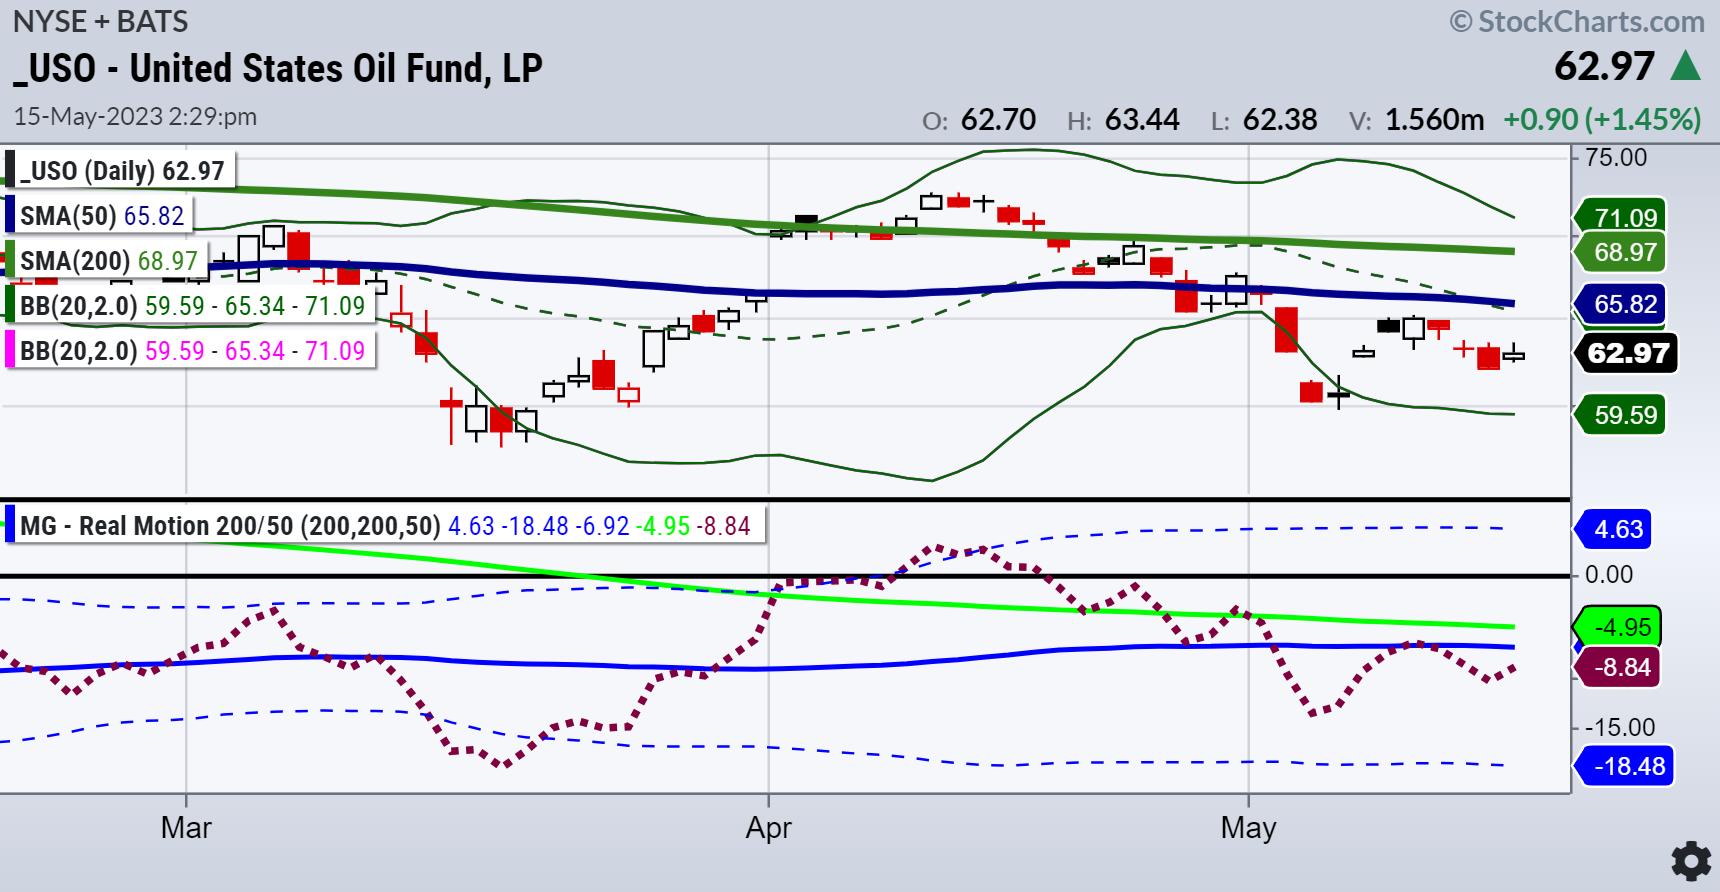
Now, in 2023, USO is under the 23-month MA, signaling more of a recession as many economists talk about. However, on the Daily charts, March brought USO to a 2-year low.
In May, we see an exhaustion gap, provided the low of 59.70 made on May 4th remains intact. Monday, USO had an inside day, trading inside Friday's range. The Real Motion momentum indicator shows a bit of a bullish divergence as the red dotted lines head closer to the moving averages. That makes the case for a possible rally should USO's price clear the 50-DMA (blue).
Summer season is about to start. The US Strategic Oil Reserves are low with stock in crude oil at 40-year lows. The plan by the US is to refill the SPR in the 3rd quarter of 2023. I'll leave it here.
For more detailed trading information about our blended models, tools and trader education courses, contact Rob Quinn, our Chief Strategy Consultant, to learn more.
IT'S NOT TOO LATE! Click here if you'd like a complimentary copy of Mish's 2023 Market Outlook E-Book in your inbox.


"I grew my money tree and so can you!" - Mish Schneider
Get your copy of Plant Your Money Tree: A Guide to Growing Your Wealth and a special bonus here.
Follow Mish on Twitter @marketminute for stock picks and more. Follow Mish on Instagram (mishschneider) for daily morning videos. To see updated media clips, click here.
Mish in the Media
In this video, Mish walks you thru the Dollar, Euro, GBP, Gold, Silver and more.
Mish walks you through the fundamentals and technical analysis legitimizing a meme stock on Business First AM.
In this appearance on Fox Business's Making Money with Charles Payne, Mish and Charles discuss if economy has contracted enough with support in place, and present 3 stock picks.
Mish covers the trading range and a few of her recent stock picks on Business First AM.
In this appearance on Real Vision, Maggie Lake and Mish discuss current state of the market, from small caps to tech to gold.
In the Q2 edition of StockCharts TV's Charting Forward 2023, hosted by David Keller, Mish joins RRG Research's Julius de Kempenaer and Simpler Trading's TG Watkins for an roundtable discussion about the things they are seeing in, and hearing about, the markets.
Mish and Dave Keller discuss why Mish believes that yields will peak in May, what to expect next in gold, and more in this in-studio appearance on StockCharts TV's The Final Bar!
Mish explains why Grandma Retail (XRT) may become our new leading indicator on the May 4th edition of Your Daily Five.
Mish discusses the FOMC and which stock she's buying, and when on Business First AM.
Mish covers strategy for SPY, QQQ, and IWM.
Coming Up:
May 18th: Presentation for Orios VC Fund, India
May 19th: Real Vision Analysis
May 22nd: TD Ameritrade
May 31st: Singapore Radio with Kai Ting 6:05pm ET MoneyFM 89.3.
ETF Summary
- S&P 500 (SPY): 23-month MA 420.
- Russell 2000 (IWM): 170 support, 180 resistance.
- Dow (DIA): Now below the 23-month MA.
- Nasdaq (QQQ): 329 the 23-month MA.
- Regional Banks (KRE): 42 now pivotal resistance; holding last Thursday's low.
- Semiconductors (SMH): 23-month MA at 124.
- Transportation (IYT): 202-240 biggest range to watch.
- Biotechnology (IBB): 121-135 range to watch from monthly charts.
- Retail (XRT): 56-75 trading range to break one way or another.
Mish Schneider
MarketGauge.com
Director of Trading Research and Education


