We started out this year thinking that the economy stagnates, and inflation has a second wave or a super-cycle.
At this point, with 5 months into the year, the recent economic stats still support that our economy is contracting.
But those numbers are looking back not forward.
Risk factors which all turned positive this past week now suggest that perhaps we can look forward to a better market other than what we have just witnessed in the tech sector.
With a market timing mechanism of a 2-year shorter term business cycle within a long term 7-year business cycle hence zooming out, the growth in chips and AI is in expansion.
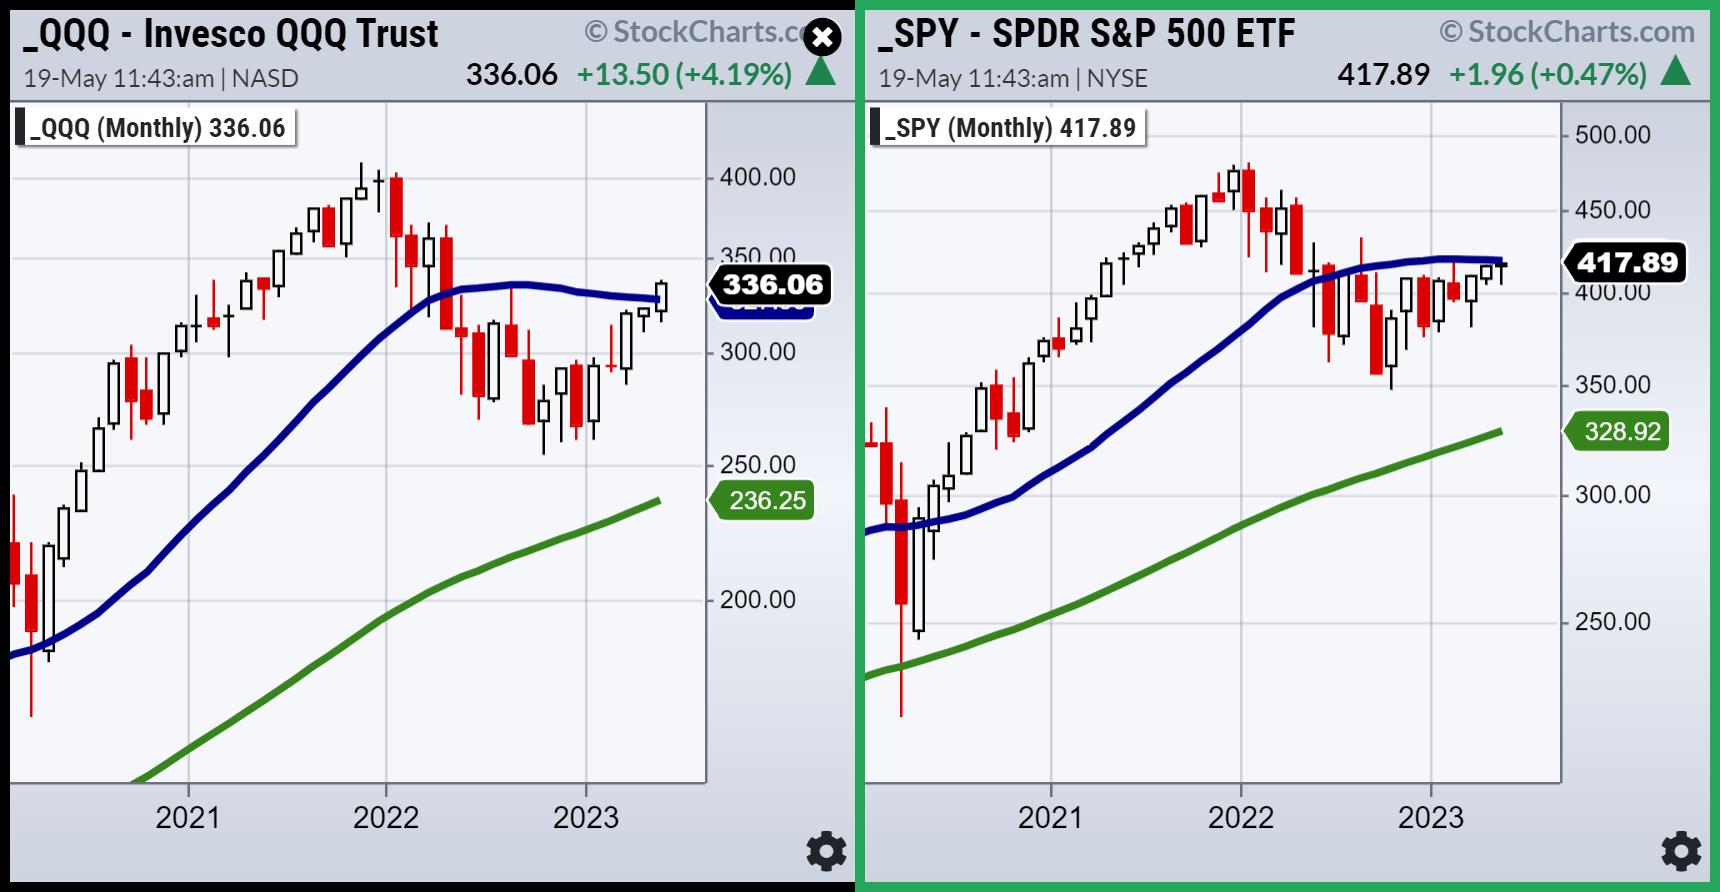
The monthly charts of NASDAQ and S&P 500 indicate that growth can continue upward if May closes out above the blue or 23-month moving average.
The SPY chart shows just how powerful that moving average is. SPY touched it, tickled it and is closing the week pretty much dancing on it.
On the other hand, the small caps, retail and even transportation are still weak.
If SPY clears 420 then it could see 440-450.
But what will small caps do?
How long can the market hold up if we are seeing nothing more than a stagnating or worse, more contracting "inside economy"?
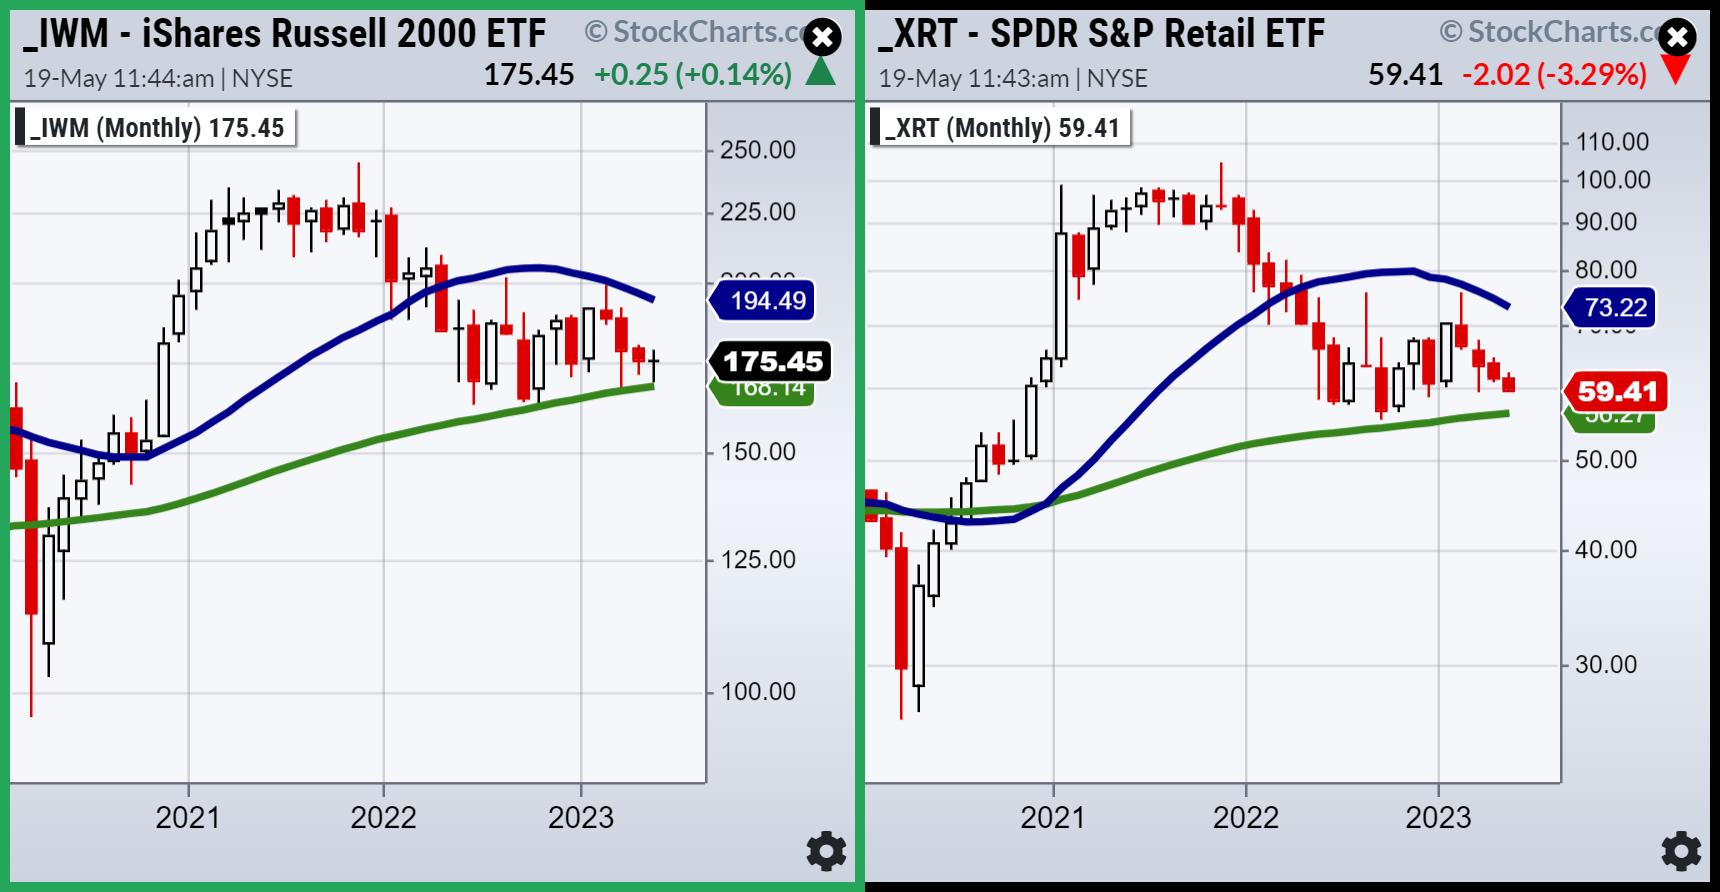
The Russell 2000 and Retail are at a completely different precipice than the SPY and QQQs.
The question is, will they contract more thereby failing the longer-term business cycle as seen by the 80-month moving average in green?
Or are they done contracting, thereby holding the 80-month MA and hence proving that we have seen the bottom of the trading range? (using October lows as major support).
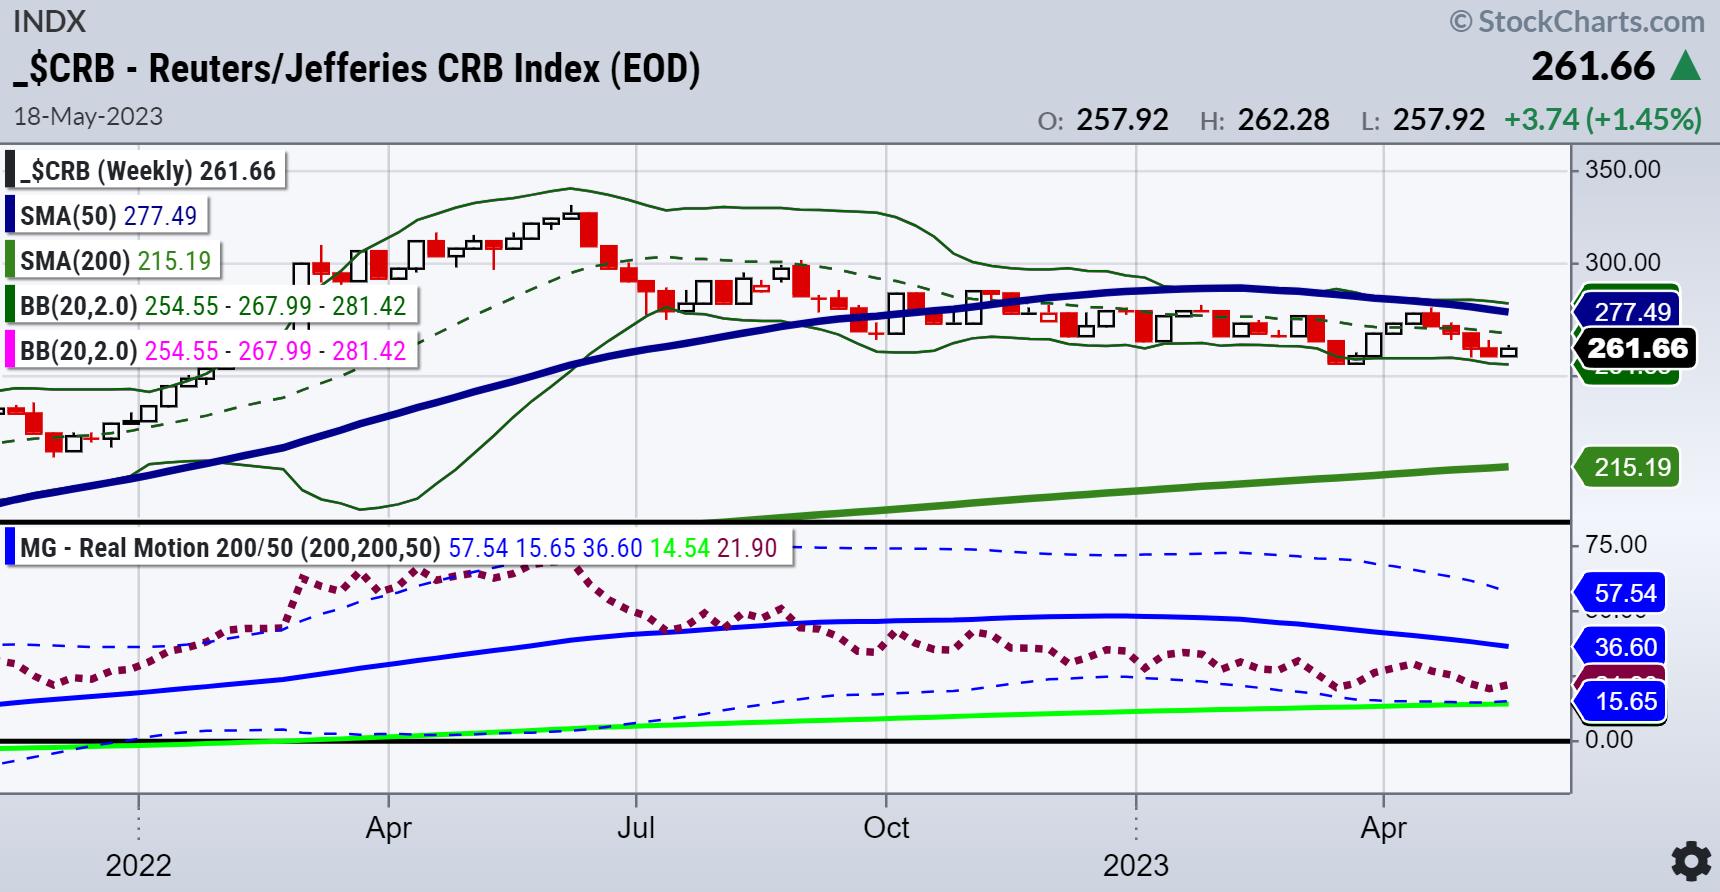
After a news-heavy week, our original thoughts about an impending super-cycle of commodities are back on the table.
The CRB index hit a 52-week low, so what seemed so clear in January has yet to play out in May, 5 months in. For the next several months, though, many inflationary bullets could resurface
Watch the momentum (Real Motion) in the CRB chart which is bouncing off the 200-daily moving average (green). And watch the price, especially if it clears back over 265. That to us would be a signal that commodities are ready to rise again. Regardless, stagflation is our yin/yang scenario.
Looking back to past peaks -the one in 2000 and then the one in 2008 (which by the way had a lower high and a lower low than the one in 2000, it took until 2013 to see new highs. Now, with the peak we saw in January 2022, one has to wonder how many years it will take to get through 4800.
For more detailed trading information about our blended models, tools and trader education courses, contact Rob Quinn, our Chief Strategy Consultant, to learn more.
IT'S NOT TOO LATE! Click here if you'd like a complimentary copy of Mish's 2023 Market Outlook E-Book in your inbox.


"I grew my money tree and so can you!" - Mish Schneider
Get your copy of Plant Your Money Tree: A Guide to Growing Your Wealth and a special bonus here.
Follow Mish on Twitter @marketminute for stock picks and more. Follow Mish on Instagram (mishschneider) for daily morning videos. To see updated media clips, click here.
Mish in the Media
Mish provides a roundup of the commodities and currency pairs to watch this week on CMC Markets.
Mish explains how the Retail ETF is at a critical level on Business First AM.
In this video, Mish walks you thru the Dollar, Euro, GBP, Gold, Silver and more.
Mish walks you through the fundamentals and technical analysis legitimizing a meme stock on Business First AM.
In this appearance on Fox Business's Making Money with Charles Payne, Mish and Charles discuss if economy has contracted enough with support in place, and present 3 stock picks.
Mish covers the trading range and a few of her recent stock picks on Business First AM.
In this appearance on Real Vision, Maggie Lake and Mish discuss current state of the market, from small caps to tech to gold.
Coming Up:
May 19th: Real Vision Analysis
May 22nd: TD Ameritrade
May 31st: Singapore Radio with Kai Ting 6:05pm ET MoneyFM 89.3.
June 2nd: Yahoo Finance
ETF Summary
- S&P 500 (SPY): 23-month MA 420; Support 410.
- Russell 2000 (IWM): 170 support--180 resistance.
- Dow (DIA): 336 the 23-month MA.
- Nasdaq (QQQ): 336 cleared or the 23-month MA-now its all about staying above.
- Regional Banks (KRE): 42 now pivotal resistance; 37 support.
- Semiconductors (SMH): 23-month MA at 124 now more in the rear-view mirror.
- Transportation (IYT): 202-240 biggest range to watch.
- Biotechnology (IBB): 121-135 range to watch from monthly charts.
- Retail (XRT): This could be the new harbinger like KRE was in March. Poor Granny.
Mish Schneider
MarketGauge.com
Director of Trading Research and Education


