Teaching an old dog new tricks means that the tricks might be new, but the notion of doing tricks is familiar.
Case in point-currencies and trading currency futures.
We have traded ETFs UUP and FXE (dollar and Euro) in the past.
And, I have been vocal through the years on predicting dollar tops and bottoms relative to other currencies.
What I have not really done much of before is look at currency pair futures. Until lately.
Because of requests from traders that live overseas, we have been doing research, education and trade ideas focused on currencies and the futures rather than ETFs.
With that, I wish to share 2 charts (on the same currency pair) that I find interesting.
The platform we are using for the charts is TradingView.
A couple of pointers ahead of the analysis.
First, the ratio is defined by the lead currency. For the Dollar to Yen charts, this is how the dollar looks in comparison. So if the chart breaks out you are buying the first currency against the second one.
Secondly, we have our Real Motion Indicator on the TradingView platform. The rules are the same as when RM is posted on any other charting platform.
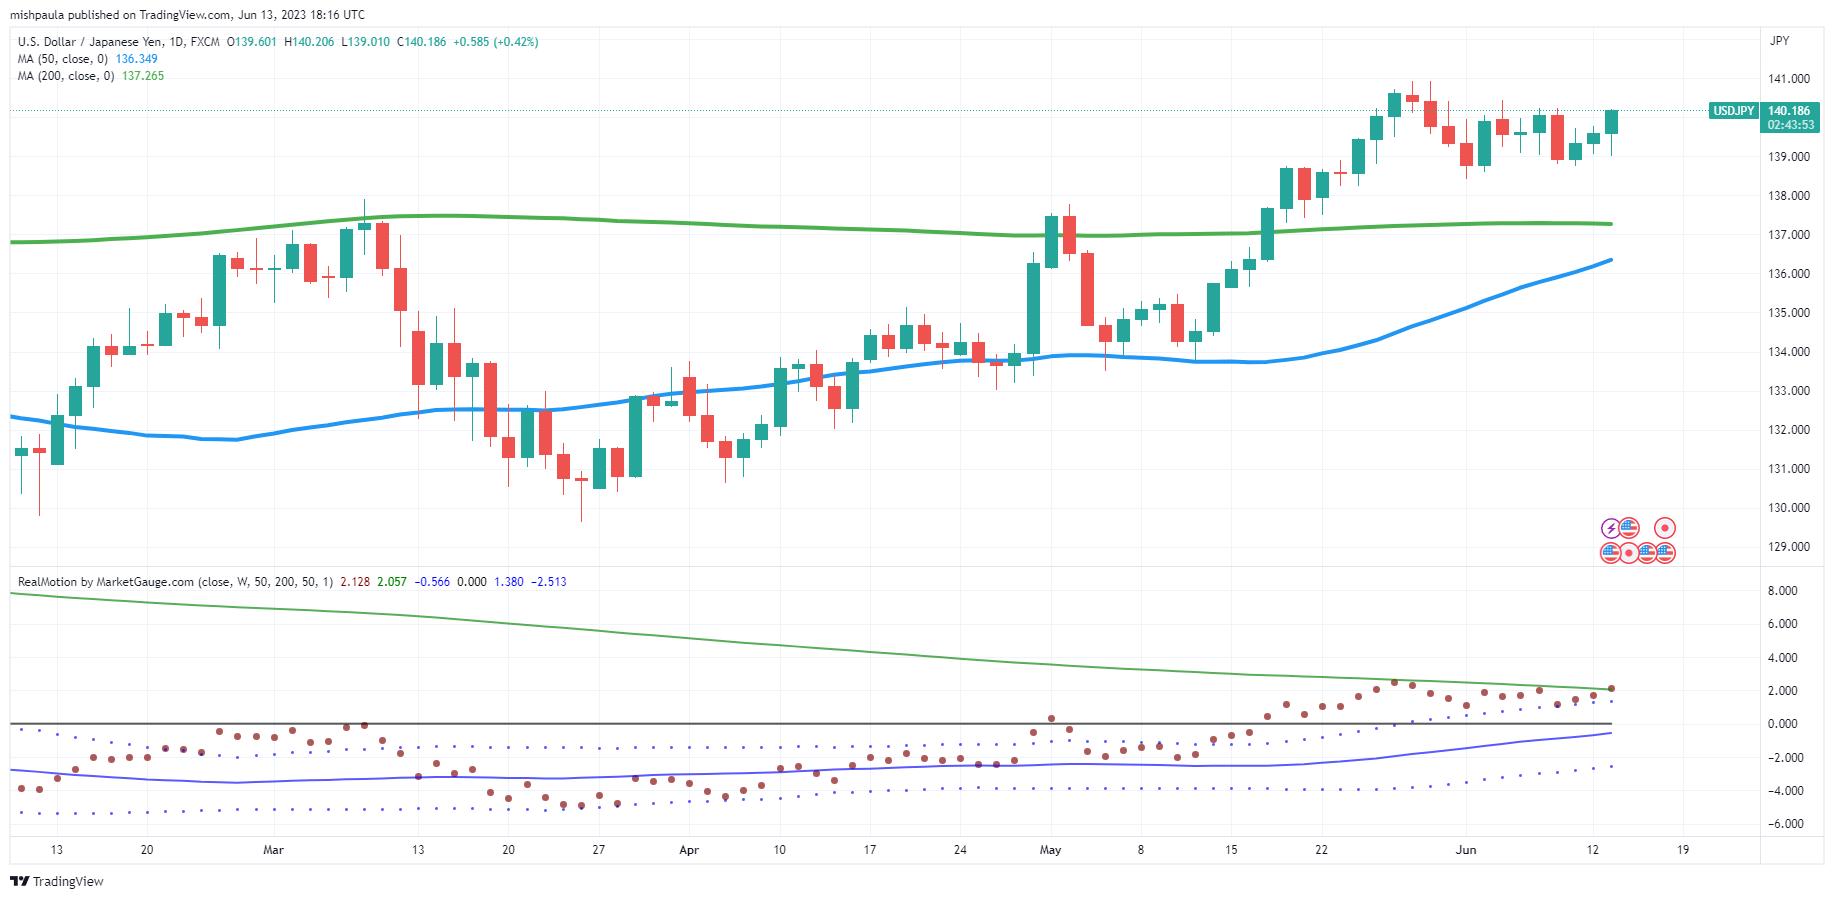
The first chart of the Dollar versus the Japanese Yen features a look since February-March 2023.
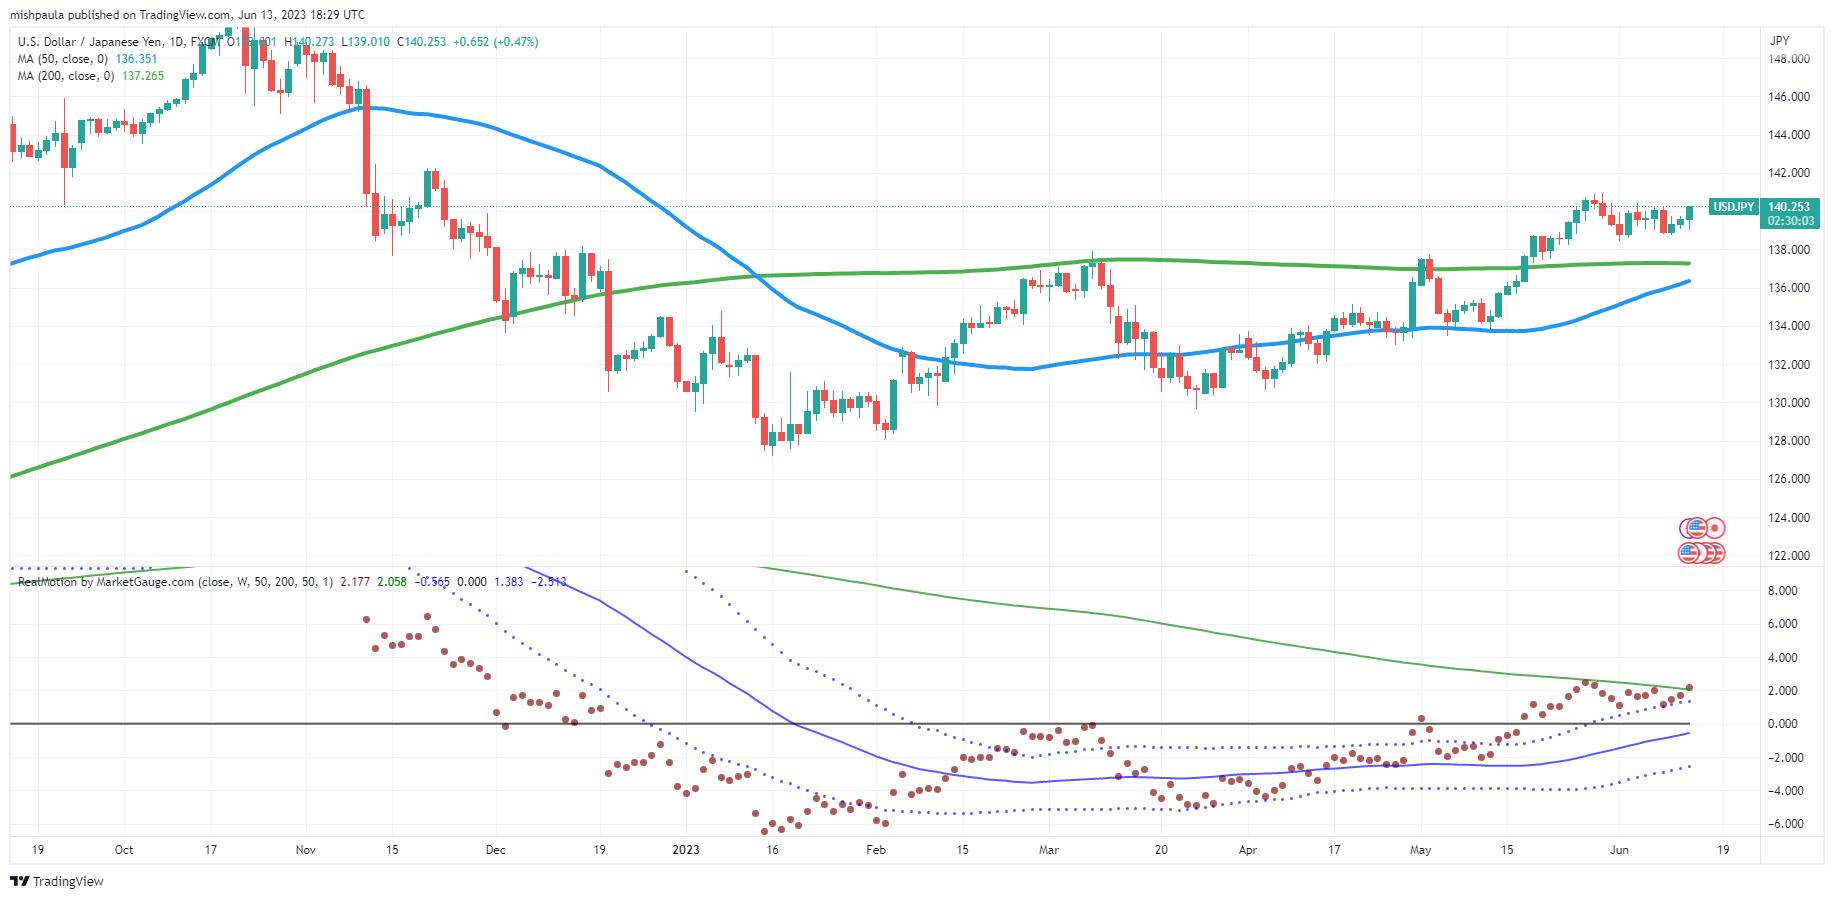
The second chart is the Dollar versus the Japanese Yen looking back to the breakdown in November 2022.
From February until mid-May, the dollar rose in price against the yen to the 200-day moving average twice and failed to clear that moving average.
On May 17th, the dollar broke out and held that 200-DMA and is now consolidating between 138 to 140.50.
Real Motion is more interesting in that the red dots (or momentum indicator) sits right on (slightly above) its 200-DMA.
The price had cleared it on May 17th. Now that momentum is finally catching up, it seems that a move above 140.75 is compelling.
The longer-term view chart tells us if the USD/YEN does indeed clear this resistance, it could run to 142, or higher.
The day it broke down hard or November 10, 2022 the selling began once price fell below 145.
That makes that level the strongest resistance.
Here are the fundamental implications:
The USD/JPY currency pair has traditionally had a close correlation with U.S. Treasuries.
When interest rates head higher, Treasury bond prices go down, which lifts the U.S. dollar, strengthening USD/JPY prices.
If the USD does indeed break out, we do have to ask, what might the implication be not only for yields, but also for the S&P 500?
Perhaps we are running too rich?
For more detailed trading information about our blended models, tools and trader education courses, contact Rob Quinn, our Chief Strategy Consultant, to learn more.

"I grew my money tree and so can you!" - Mish Schneider
Get your copy of Plant Your Money Tree: A Guide to Growing Your Wealth and a special bonus here.
Follow Mish on Twitter @marketminute for stock picks and more. Follow Mish on Instagram (mishschneider) for daily morning videos. To see updated media clips, click here.
Mish in the Media
Mish offers her technical forecasts for gold, EUR/USD, USD/JPY and WTI Crude Oil ahead of today's CPI report on CMC Markets.
Mish Schneider and TG Watkins continue their chat about the business of trading in this video from StockCharts TV. Topics range from their work/home life balance, how being a consumer does or does not play into their trading decisions, and what they do in their free time to unwind.
Mish and Nicole Petallides go over rates, key sectors and the economy in this video from TD Ameritrade. They also discuss what raw materials are coming into vogue.
Mish and Jon talk about what could make markets continue or reverse and what to buy right now on BNN Bloomberg's Opening Bell.
Mish and Charles talk inflation fears, the "wall of worry" and trading large-caps on Fox Business' Making Money with Charles Payne.
The first 5 months of 2023 have been rallying on optimism going forward. Will that continue for the next few months? Mish digs into that question in this Twitter Spaces conversation with Wolf Financial.
Mish discusses impacts of weather, labor market and the FED on tap on Fox Business' Coast to Coast with Neil Cavuto.
The US dollar rallied following a positive US jobs report last Friday, but could the Federal Reserve's upcoming interest rate decision halt the greenback's rise? Mish offers her views on USD/JPY, the S&P 500, and light crude oil futures on CMC Markets.
Mish talks GME (Gamestop) and more on Business First AM.
Where is the US economy actually heading? Rajeev Suri of Orios discusses this question and what trends suggest with Mish in this video.
Mish joins Rajeev Suri of Orios Venture partners to discuss the Fed, inflation, and buybacks in this video on LinkedIn.
In this episode of StockCharts TV's ChartChats, Mish Schneider and TG Watkins (creator of the Moxie Indicator) sit down for a candid chat about working with other StockCharts contributors. Learn what TGs strategy for trading is, and how the the Moxie Indicator came to be. Mish shares her background and how she got started in the industry.
With Congress having reached a deal after months of debt ceiling talks, what direction could the US dollar move in, and what could this mean for the USD/JPY? Mish explores the market movements in this appearance on CMC Markets.
Mish joins Rajeev Suri of Orios Venture partners to discuss the trend toward a risk-on situation in this video on LinkedIn.
Mish weighs in on the overnight slump across the board on the benchmarks and where the momentum is heading on Singapore Breakfast, available on Spotify.
Mish explains how reversal patterns could come to the fore this week in this appearance on CMC Markets.
Mish joins Rajeev Suri of Orios Venture partners to discuss the possibility of economic stagflation in this video on LinkedIn.
Mish discusses how AI is being used to invest in this article for BNN Bloomberg.
Coming Up:
June 13: Daily Briefing on Real Vision
June 14: CMC Live Trading in London 1:30 ET
June 22: Forex Premarket Show with Dale Pinkert
June 23: Your Daily Five on StockCharts TV
ETF Summary
- S&P 500 (SPY): Another move higher-starting to think we are close to a top 440 target.
- Russell 2000 (IWM): 23-month MA 193 still a bit away.
- Dow (DIA): 34,000 in the Dow-thinking next 6-months not as pretty.
- Nasdaq (QQQ): 370 max target.
- Regional Banks (KRE): 42 support, 44 pivotal.
- Semiconductors (SMH): 150 now maj0r support. Lots of models took profits into this run.
- Transportation (IYT): 237 area the 23-month moving average.
- Biotechnology (IBB): 121-135 range.
- Retail (XRT): Cleared the 200-DMA at 62.95-if this is good, it will stay above that level


