An interesting article based on cycles and commodities versus stocks suggests that over the past 90 years, stocks have outperformed commodities by 4 to 1. Within those 90 years, though, there are times that commodities outperform stocks, generally for about 15 years.
The author believes that we will see such a cycle begin July 1, 2023, and conclude June 30, 2038. Now, granted, this is cycle work with no fundamental reasons cited. Nonetheless, it caught my attention, as those of us who still believe commodities are in for a second wave higher are dwindling in population.
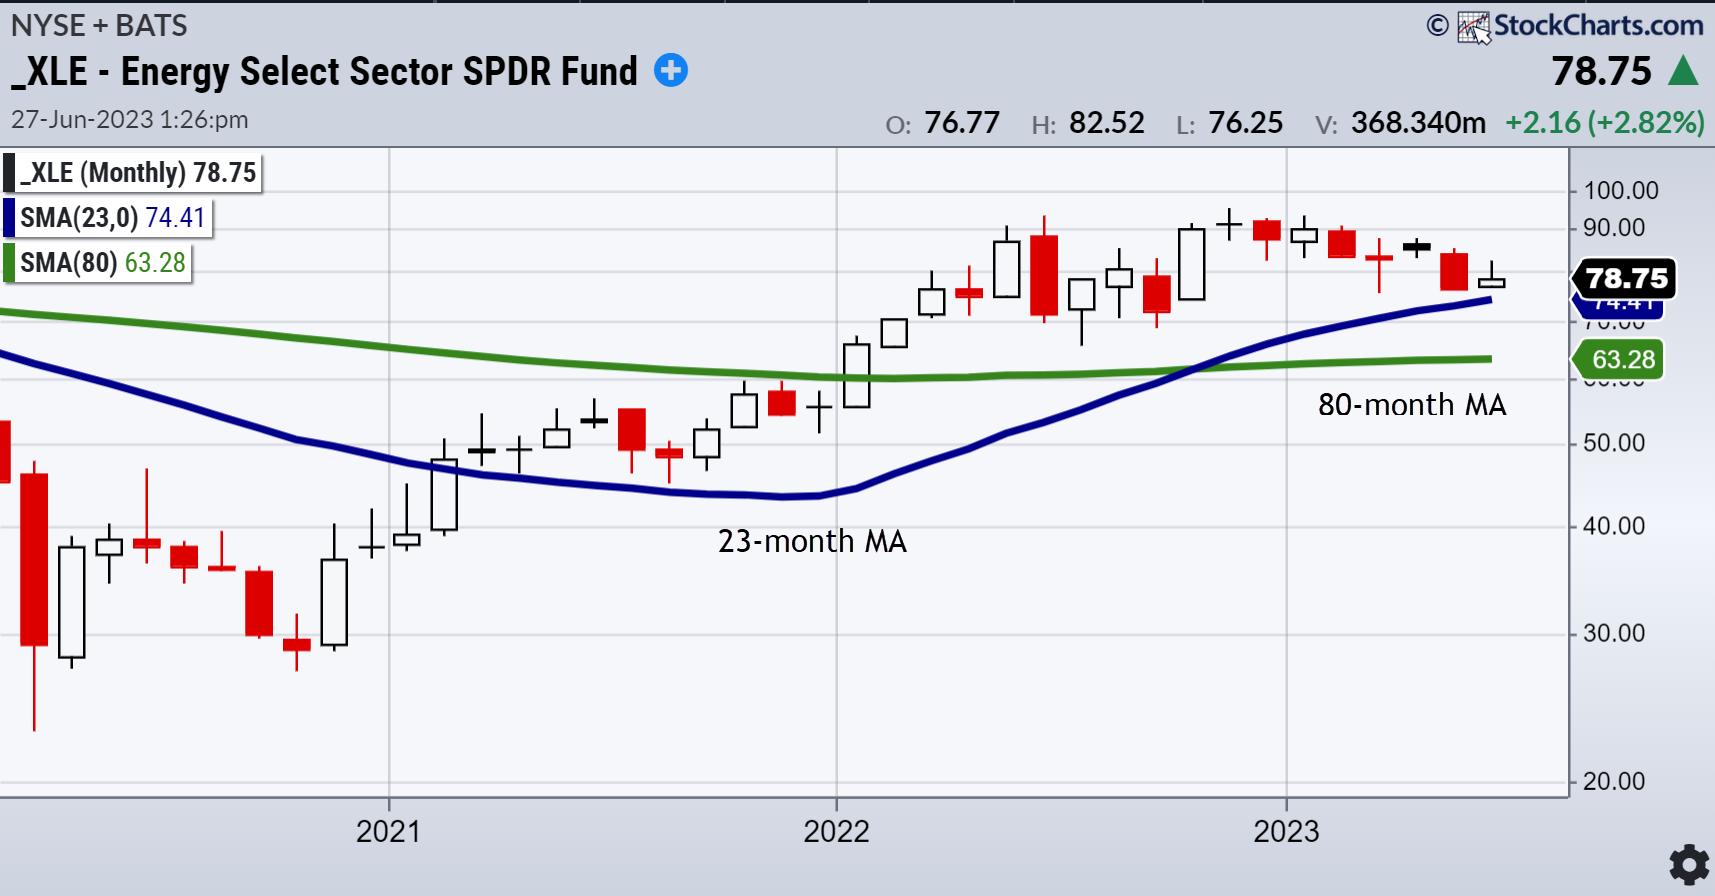
Which, of course, also has my attention by the mere fact that investors have short memories on the value of raw materials in short supply that are further impacted by weather, geopolitics, social unrest, and rising demand. Furthermore, just look at a monthly chart and think expansion as measured by the 23-month moving average or roughly 2-year business cycle.
The SPY is above the 23-month MA, as is Transportation (last night's daily), technology and NASDAQ. The Russell 2000, Retail, Banking and Biotech sectors, though, are nowhere near that MA--in fact, maybe more hinting at further contraction.
The energy ETF XLE is a good example of an area of commodities that went into expansion in 2021 and has since consolidated. In this consolidation and correction, XLE holds the 23-month MA.
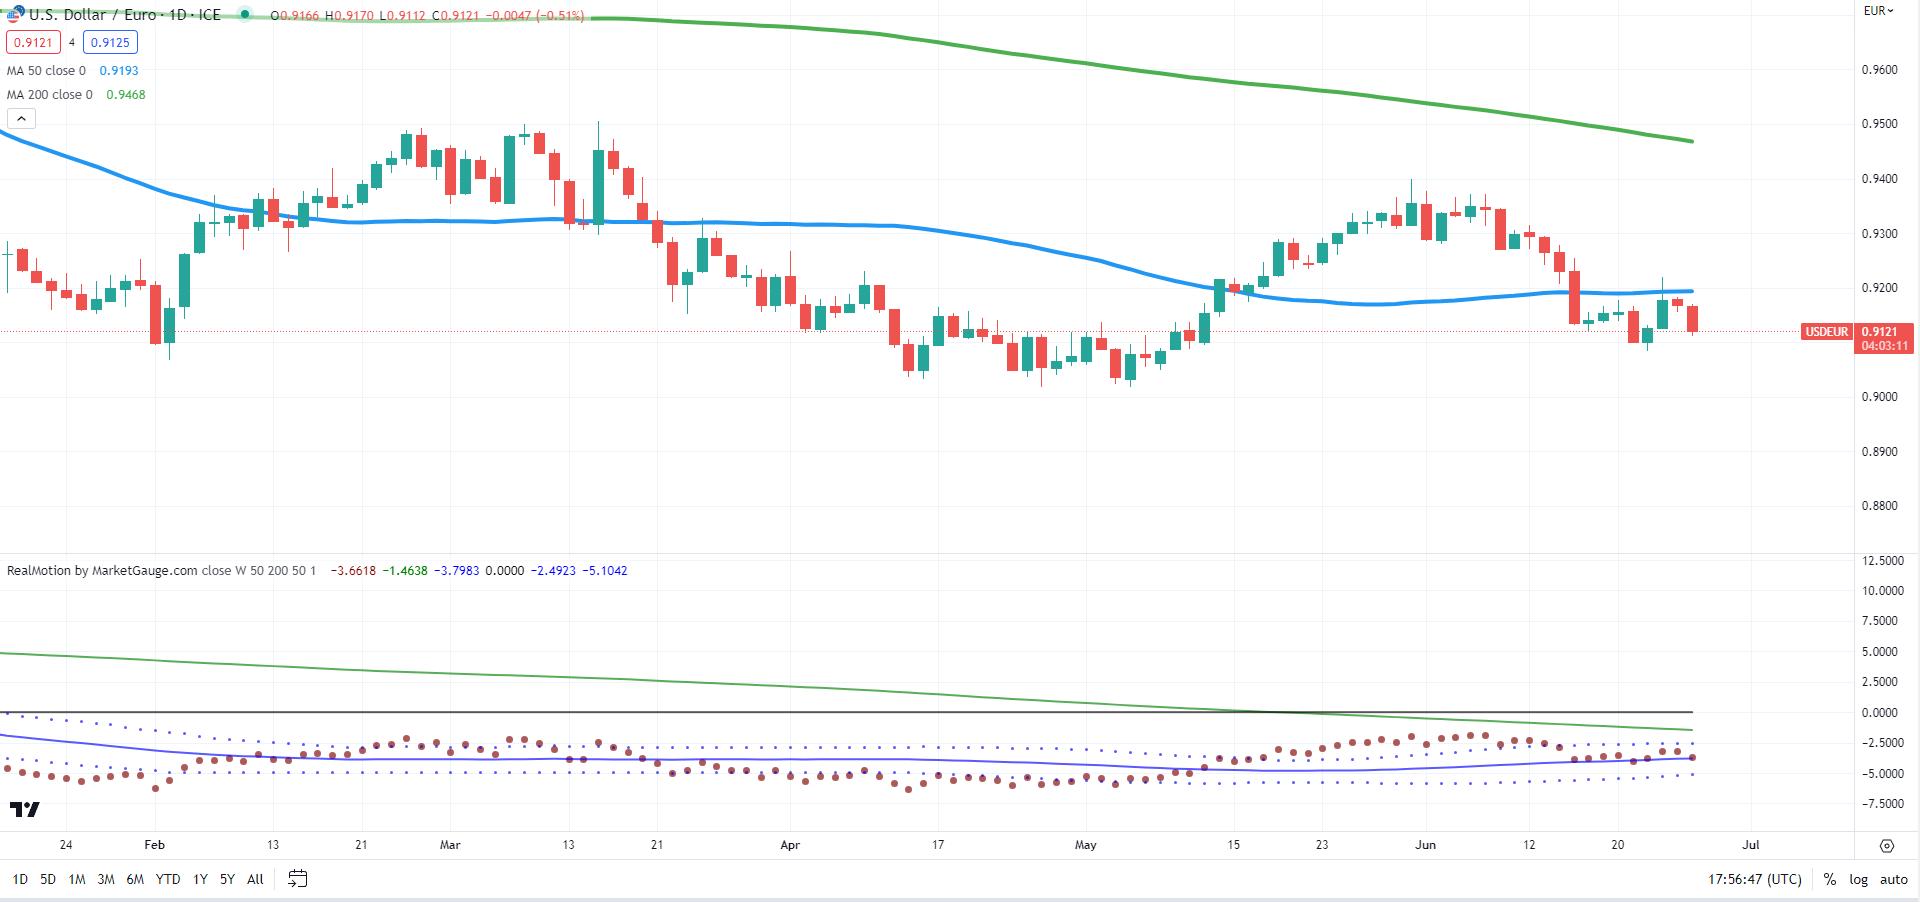
The chart of the dollar against the Euro is also of interest if one believes currencies have anything to do with a potential commodity bull cycle. This is a daily chart that shows the dollar is breaking down. The currency pair illustrates the dollar is vulnerable to the Euro, with its position in a bearish phase. Price is trading under both the 50- and 200-DMAs, and the stack in also in a bearish phase.
Real Motion, or the momentum, is in better shape as the red dots sit on the 50-DMA, keeping the phase just slightly above bearish. Should the U.S. Dollar/Euro break down under .90, that could confirm the start of a much bigger commodities cycle. However, at this point, XLE has to hold above 75.00. And the dollar could just as easily hold support against the Euro and rally above .92.
One thing for certain; this 15-year cycle will reveal itself very soon.
For more detailed trading information about our blended models, tools and trader education courses, contact Rob Quinn, our Chief Strategy Consultant, to learn more.

"I grew my money tree and so can you!" - Mish Schneider
Get your copy of Plant Your Money Tree: A Guide to Growing Your Wealth and a special bonus here.
Follow Mish on Twitter @marketminute for stock picks and more. Follow Mish on Instagram (mishschneider) for daily morning videos. To see updated media clips, click here.
Mish in the Media
Mish discusses how business have been watching Russia in this appearance on Business First AM.
Read Mish's commentary on how the situation in Russia impacts the markets in this article from Kitco.
Watch Mish's 45-minute coaching session for MarketGauge's comprehensive product for discretionary traders, the Complete Trader.
On the Friday, June 23 edition of StockCharts TV's Your Daily Five, Mish covers a variety of stocks and ETFs, with eyes on the retail sector for best clues in market direction.
Read Mish's interview with CMC Markets for "Tricks of the Trade: Interviews with World-Class Traders" here!
Mish delves into the potential next market moves for several key markets, including USD/JPY, Gold and West Texas crude oil in this appearance on CMC Markets.
Mish and Dale Pinkert cover the macro, the geopolitical backdrop, commodities, and stocks to watch on FACE Live Market Analysis and Interviews.
Mish and Ashley discuss buying raw materials and keeping an eye on Biotech on Fox Business's Making Money with Charles Payne.
Coming Up:
June 27: The Final Bar with Dave Keller on StockCharts TV
June 28: Twitter Spaces with Mario Nawfal (8am ET
June 29: Twitter Spaces with Wolf Financial (12pm ET)
July 6: Yahoo Finance
July 7: TD Ameritrade
ETF Summary
- S&P 500 (SPY): 430-437 tight range.
- Russell 2000 (IWM): 180 held; can we get back over 185?
- Dow (DIA): 33,500 the 23-month MA, now back above.
- Nasdaq (QQQ): 360 support and an inside week.
- Regional Banks (KRE): Back over 40, so now we need a new move over 42.
- Semiconductors (SMH): 150 back to pivotal.
- Transportation (IYT): 238 area the 23-month moving average support thus far.
- Biotechnology (IBB): 121-135 range.
- Retail (XRT): Over 63, so optimism returns.
Mish Schneider
MarketGauge.com
Director of Trading Research and Education


