Diversification works well in sample cases, but how about in actual trading? In this article, we’ll combine two assets you can actually buy and sell. • When you add to an all-stock portfolio an asset that has a low or negative correlation to stocks, the result is a more diversified portfolio that can subject you to smaller losses with the possibility of larger returns.

Figure 1. Diversifying a portfolio in even the simplest way, with only two assets, produces some great benefits that may not seem obvious. Photo by Vi Chizh/Shutterstock.
• Part 3 of a series. Parts 1 and 2 appeared on Mar. 19 and 21, 2019. •
Earlier in this series on diversifying your portfolio, we saw how two assets can produce a greater return than either asset by itself. The magic of diversification works in ways that the human mind doesn’t assume.
But beyond artificial examples, what about combining assets whose returns we don’t know in advance? What about actual securities that we can actually buy and sell to make more profit from investing? Prepare to be surprised.
Today, we’ll see a real example using the S&P 500 and one other class of assets. Both of these asset classes have been easy to buy and sell for decades, using exchange-traded funds or — before ETFs were invented — index mutual funds. Buying a “basket” of assets rather than individual securities keeps transaction costs low.
What asset class should we add to stocks in our example today? To get the benefits of diversification, we want an asset that has a low correlation to stocks or a negative correlation. When stocks go down, as they do, we want an asset that balances that by sometimes going up when stocks are in a nose dive.
Assets with a low correlation to stocks include cash, commodities, and precious metals. Cash has zero correlation with stocks, as we saw in Part 1 of this series. Cash in a money-market account goes up a little each day, regardless of whether the stock market went up or down. Commodities and precious metals have recently varied between a correlation of roughly 4% and 44%, which represents a very small relationship to the stock market.
The asset that has the most negative correlation to stocks is bonds. Long-term US Treasury bonds have a correlation to the stock market of about negative 40%. US corporate bonds’ correlation is about negative 32%. Stocks and bonds frequently rise and fall in the opposite direction from each other. (All of the above correlation statistics change from year to year. Commodities, precious metals, and even bonds become highly correlated with stocks for short, unusual periods. Don’t worry about the exact numbers at this point in the series.)
Figure 2 shows the total return over 43 years of the S&P 500 (which is tracked today by Vanguard’s VOO exchange-traded fund and VFIAX mutual fund) and US corporate investment-grade bonds (tracked by VCLT and VLTCX, respectively). Bonds returned 8.9% annualized since 1973, while stocks returned 10.0%.
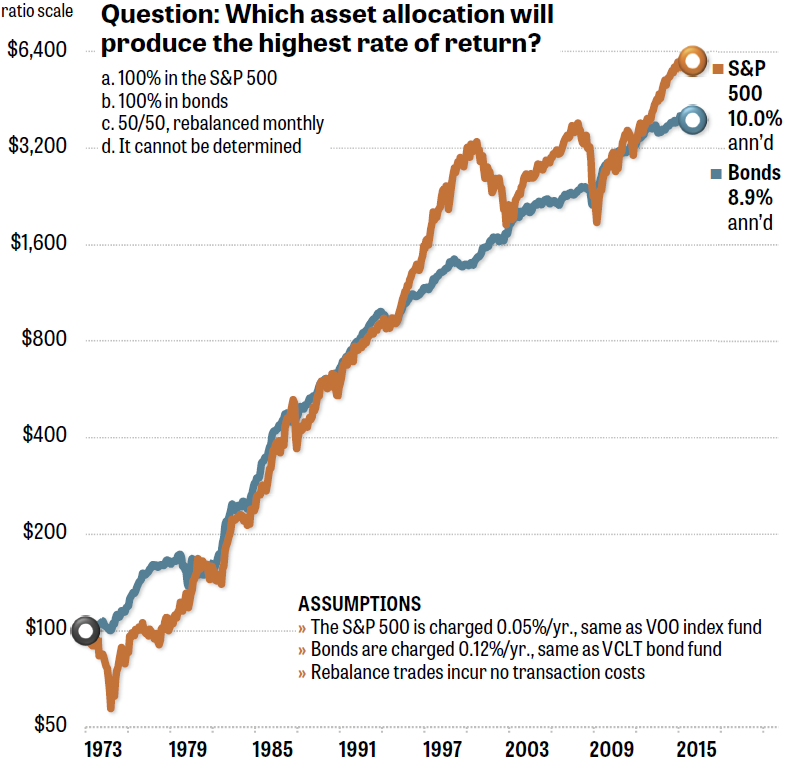
Figure 2. The S&P 500 and an index fund of US corporate investment-grade bonds pulleed ahead and behind each other at different times. Source: The Idea Farm’s Quant simulator.
Today’s quiz is as follows:
Which asset allocation will produce the highest rate of return?
a. 100% in the S&P 500
b. 100% in bonds
c. 50/50, rebalanced monthly
d. It cannot be determined
For the purposes of this example, no transaction costs are charged to any of the three portfolios. In a 50/50 account, making small rebalancing trades using two ETFs can be very inexpensive or even commission-free today. Better yet, if you regularly deposit some of your paycheck into your account, or you make withdrawals in retirement, it’s cheap and easy to use “cash-flow rebalancing.” This means you make each month’s deposit or withdrawal using whichever asset should be brought closer to a 50/50 proportion.
Make a note of your answer, for your own reference when you see the answer in Figure 3.
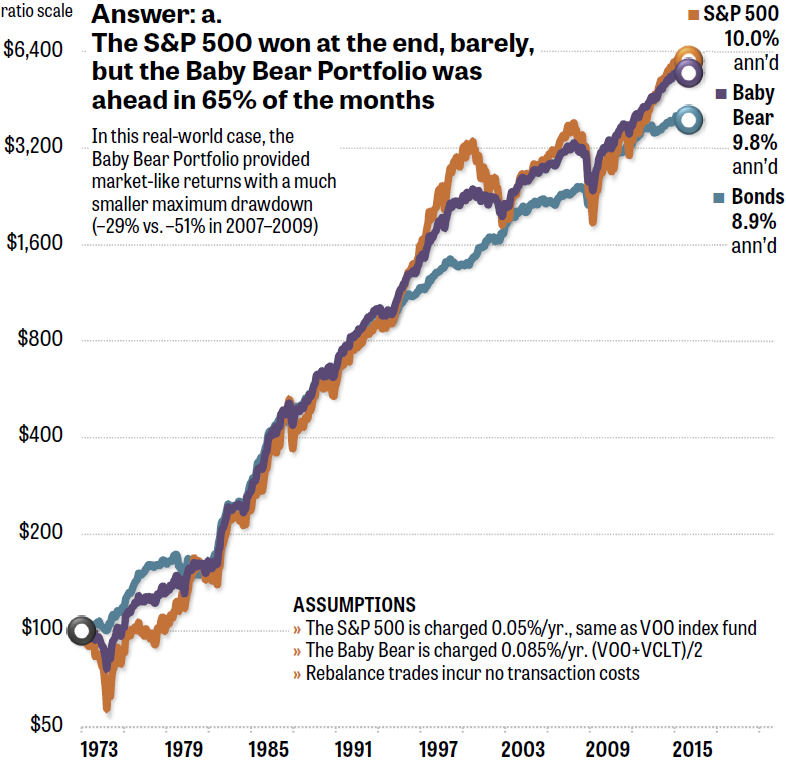
Figure 3. The S&P 500 ended this particular 43-year period slightly ahead of a 50/50 portfolio. However, the 50/50 diversified account had more money in it at the end of 65% of the months in the time frame shown.
The answer is “a.”
If you thought (based on the previous examples in this series) that diversification always guaranteed a superior performance than either of two assets, that’s not always the case.
- In Figure 3, the S&P 500 eked out a small win at the end, returning 10.0% annualized.
- The 50/50 account — which the book Muscular Portfolios calls the Baby Bear Portfolio, due to its simplicity for novice investors — returned almost as much (within a rounding error) as the S&P 500 benchmark: 9.8% annualized.
- Over the course of the 43 years, the Baby Bear Portfolio would have had more money in it than the S&P 500 in 65% of the months. In other words, that’s when the purple line in the graph was above the orange line. Most of the time, you would have been distinctly richer with the diversified portfolio than a 100% equity position.
- Notice that the 50/50 portfolio’s 9.8% return is NOT the average of the S&P 500’s 10.0% and bonds’ 8.9%. The average would be 9.45%, but the 50/50 account actually returned significantly more: 9.8%.
- The reason is the magic of diversification. In the 2007–2009 crash, the S&P 500 (including dividends) was down 51%. But the 50/50 portfolio was down only 29%. The diversified portfolio recovered from the bear market more quickly, and then stayed ahead of the S&P 500 from 2009 until nearly the very end of the period.
It’s not how much you make in bull markets, it’s how much you keep in bear markets that determines your lifetime investment gain.
The Federal Reserve maintained a zero interest rate policy (ZIRP) for many years after the global financial crisis. This has made many people believe that bonds deliver little more than a 0% return and should be avoided. But the Fed’s low rate affected only very short-term funds, such as overnight loans between banks. The Fed rate and all other bond rates have risen notably since then. The truth is that a bond position in your portfolio keeps pumping money into your account when stocks are costing you dearly.
As of Mar. 22, Vanguard’s VCLT and VLTCX are both paying an SEC-standardized yield of 4.56%. In 2018, the S&P 500 (including dividends) cost equity investors minus 4.43%. Stocks go down in approximately 40% of all months. That’s when the bond component of a portfolio works for you.
(Note: At this writing, Vanguard charges a 1% front-end load for retail investors to buy into the VLTCX mutual fund. So, if you need a US corporate bond fund, it’s better to buy the VCLT exchange-traded fund. Like all ETFs, VCLT has no front-end load.)
In the fourth and final part of this series, we’ll see how we can make greater gains. Using a wider selection of securities, now that low-cost index funds are available for asset classes around the world, we’re no longer limited to just the old, traditional choice between stocks and bonds.
• Part 4 appears on Mar. 28, 2019.
With great knowledge comes great responsibility.
—Brian Livingston
Send story ideas to MaxGaines “at” BrianLivingston.com