Big bounces all over the place, not just in equities. In this article I want to take a look at relative rotation at an asset class level, of course, using an RRG lens.
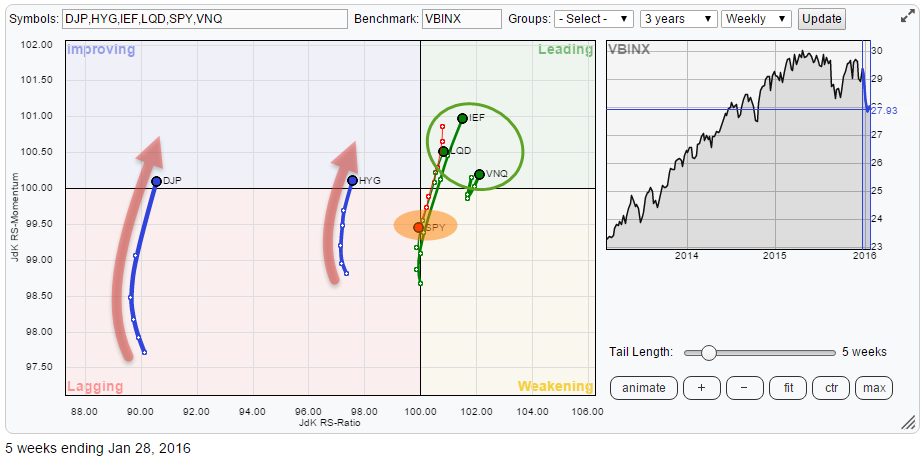
The Relative Rotation Graph below shows the relative trends in play for several asset classes over the past six weeks.
Summary
- Commodities (DJP) and High Yield (HYG) stand out on the RRG
- DJP fulfills price target. End of the down-move?
- Equities (SPY) heading lower on JdK RS-Momentum axis while Government bonds (IEF), IG Corporate bonds (LQD) and Real Estate (VNQ) are pushing higher into the leading quadrant
- Equities / Bonds ratio (SPY:IEF) suggests $ 165 target for SPY
Quick scan
Looking at the RRG above, the tails of DJP (Commodities) and HYG (High Yield bonds) immediately catch the attention. They are, way, inside the lagging quadrant but started to move higher on the JdK RS-Momentum axis. The other sectors are a bit clustered near the benchmark, which in this case is the Vanguard Balanced Index fund, with SPY (equities) heading down on the RS-Momentum scale while IEF (Government bonds), LQD (Investment grade bonds) and also VNQ (Realt Estate) are moving in opposite direction.
VNQ (Real Estate) is showing a sharp turn higher and seems to be showing the strongest relative trend at the moment based on the level of the JdK RS-Ratio.
Commodities - DJP
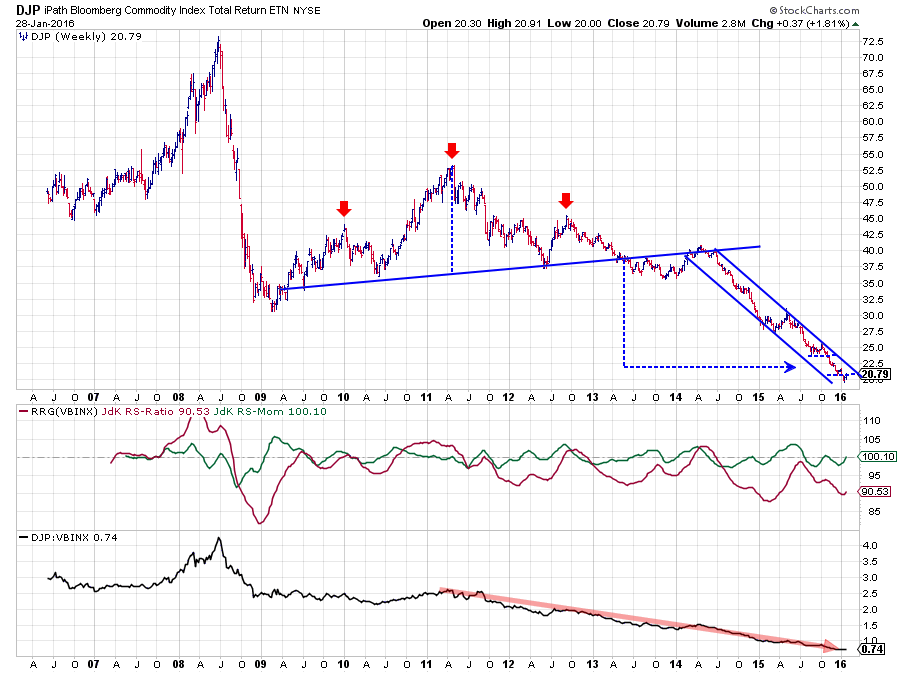 The commodities market, represented by the iPath Bloomberg Commodity Index in the chart above (weekly) continues to look horrible. There is no doubt about the fact that this is a text-book, downtrend which is pushing deeper and deeper into uncharted territory ... on the downside that is.
On the Relative Rotation Graph, DJP shows up at the far left edge of the plot, pretty much "detached" from the rest of the asset classes. An immediate turn up from such low JdK RS-Ratio levels is (almost) impossible. A market needs much more time and positive price action to rotate from such a position in the lagging quadrant into the leading quadrant.
However, in cases like this, it is always tempting to see if we can find arguments for such a severe move to stall and possibly start a bottoming out process. With no historical reference points available that could serve as some sort of support, this is difficult. But when I switched to a longer term chart of DJP I noticed that the 2009-2012 price action can be seen as a, very big, Head & Shoulders continuation pattern.
Working from this assumption, a price target, based on the H&S formation, can be established just below $ 22.50 as indicated by the blue dashed lines on the chart. In the past few weeks, DJP has reached and traded below this level which means that the minimum, price target based on the H&S pattern has been fulfilled.
This is by no means a call that the drop in commodities will stop here and now. But, for me, it means that I will be starting to look at commodities with a slightly more open mind for a bottoming process to start anytime soon.
High Yield corporate bonds - HYG
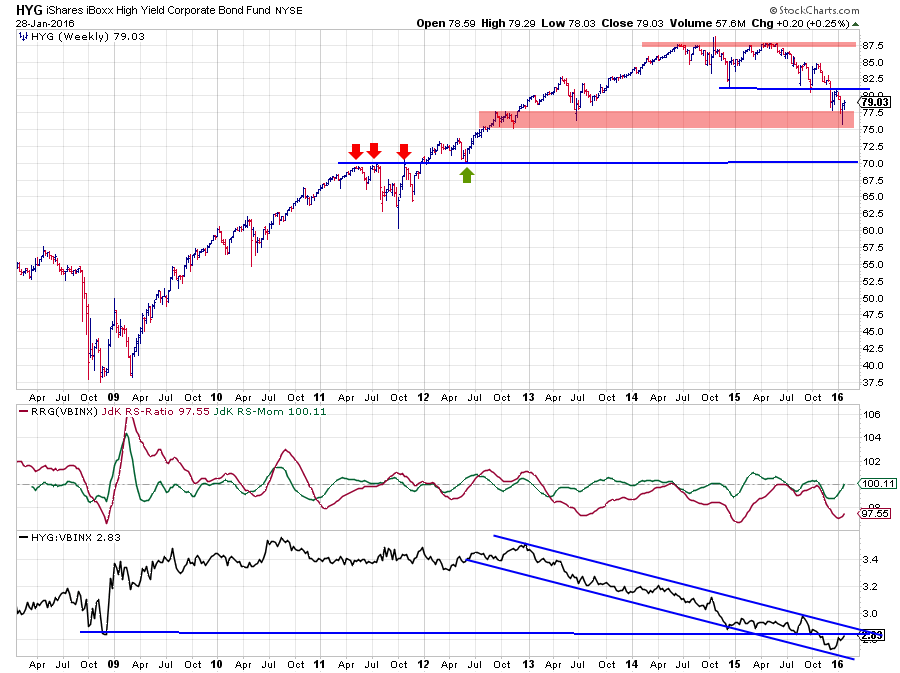 The second asset class inside the lagging quadrant but moving higher on the RS-Momentum axis is High Yield corporate bonds. The only difference with commodities is that this turn is taking place at an RS-ratio level much closer to 100.
On the price chart above the falling trend, characterized by lower highs and lower lows is clearly visible. This downtrend recently got confirmed by the break below the late 2014 low which marks the completion of a double top formation. After this break, HYG dropped further and seems to be testing the support zone between $ 75.00 and $ 77.50 at the moment. Upside potential in the near term is blocked by resistance levels coming off both the former support level and the falling resistance line over recent price peaks.
From a relative point of view, things do not look much better. The raw RS-Line is moving lower within the boundaries of a falling channel since late 2012. Very recently this downtrend broke below the late 2008 (!) low in relative strength. Just like on the price chart, this makes the upward potential for relative strength very limited as it will have to conquer both the falling resistance line as well as the former support level on its way up.
Any rallies in HYG on both the price- and the relative strength charts, off of current levels will probably be short-lived as there is a lot of overhead resistance waiting on both charts.
Investment Grade Corporate Bonds - LQD
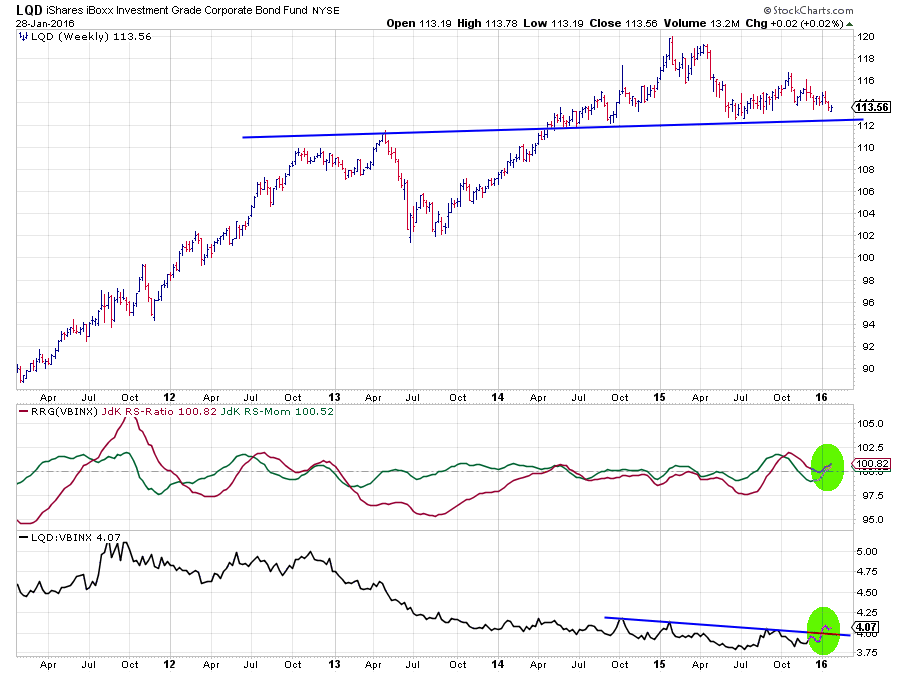 The LQD chart above is sending a mixed picture.
The top graph (price) shows a market which broke (downward) from a rising trend and is currently testing a, nearly, horizontal support level coming off a previous major peak. And as a first lower high is already in place a downward break below this support level is very well possible. In that case, an acceleration of the downward move may be expected.
When we switch to the relative strength charts below the price chart we see a different message. Here we see a raw RS-Line in the bottom pane that slowed the pace of its deceleration already in the beginning of 2014. Since then RS still moved lower but at a much slower pace.
This slowdown caused the JdK RS-Ratio line to get back up towards the 100 level and stay there for over a year. In September 2015 the RS-Ratio crossed above the 100 level, suggesting that a new uptrend in relative trend had started. It took another dip and some more months in time before this actually began to materialize but it looks as things really begin to turn now. The RS-Line has broken above it's slightly down-sloping resistance line while the recent low in RS was (a bit) higher than the previous one. RS-Ratio has shaved the 100-level but started to turn up as well again.
All in all, and despite the not so strong price chart, it looks like LQD is set to start/continue its relative uptrend against VBINX in coming weeks/months.
Government bonds - IEF
 Among the fixed income related asset classes in this universe, government bonds, naturally, play a leading role.
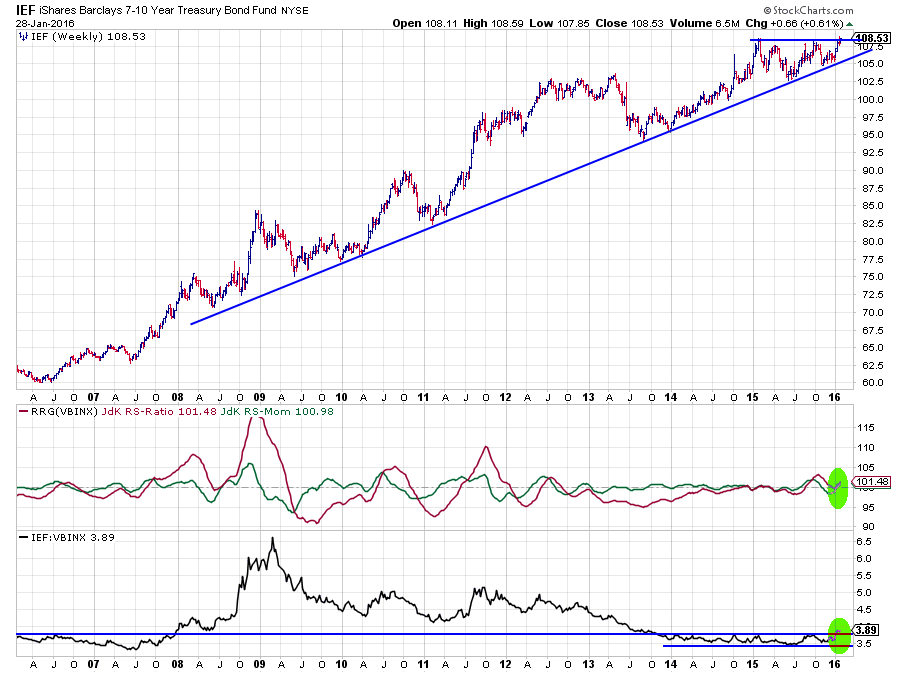
The chart above shows the long-term price development of IEF, which represents US Government bonds with a maturity between 7-10 years. The significant drop in yields, a rise of the index/ETF, is clearly visible. And where a lot of people are or were, looking for yields to start rising, hence a downturn in IEF, things start to look differently... at least IMHO.
On the price chart above, the uptrend is fully intact, not even threatened. As a matter of fact, we only need a little bit more upside, and IEF will break to new highs, thus confirming the uptrend and probably triggering an acceleration of yields going lower.
Based on the preceding pattern, one could argue about an ascending triangle or an inverted H&S continuation pattern, a price target could be pegged around $ 110 (adding depth of the pattern, $ 2.50, to the breakout level).
Comparing IEF to a balanced benchmark like VBINX, as is done in the relative strength related charts in the lower two panes, confirms the relative strength of government bonds within this universe. The raw RS-line seems to be breaking upwardly from a long sideways range while the JdK RS-Ratio line just bottomed out against the 100-level and seems to be resuming its move higher, backed by an also rising JdK RS-Momentum line.
Therefore, taken from these developments on the charts, a rise in yields at short notice seems very unlikely. On the contrary, this suggests that we will see a drop in yields going forward...
Equities / Bonds - SPY:IEF
 Ultimately most readers, including me :), on "STOCK"charts will be interested to know what the effect of all these asset class movements will be in the equity markets, i.e., SPY.
To get a handle on the equity market from an asset allocation perspective, the Equity/Bond ratio is a good gauge to look at.
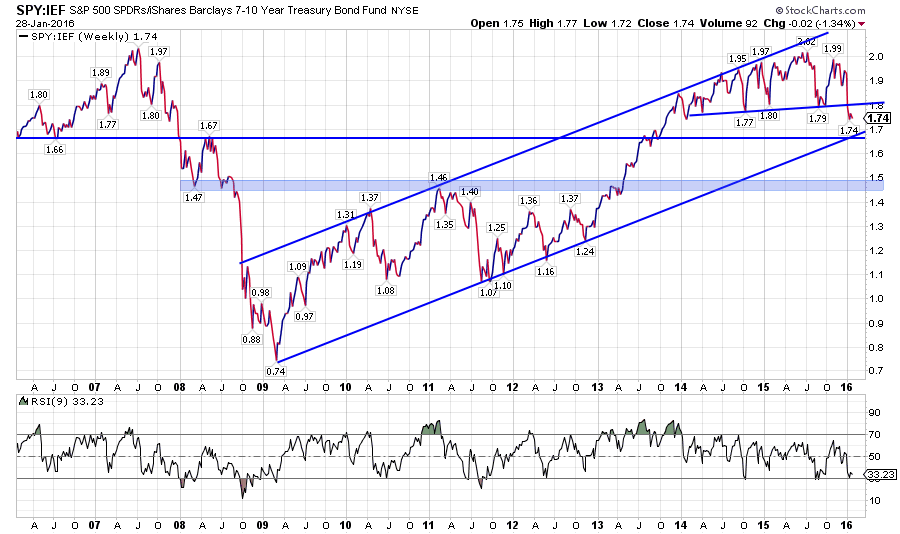
Looking at the chart of this ratio above, the uptrend out of the 2009 low is very well visible. What we can see is that starting in 2015, the peaks did not make it all the way up to the rising resistance line anymore, indicating that the trend began to weaken. This process became more prominent when in 2015 the second major peak was set lower than the first one. The recent decline pushed the SPY:IEF ratio below a support line connecting the last few lows. Currently, the lower boundary of the rising channel is threatened. The area between 1.65 - 1.70 seems the next support level to watch.
Once this area breaks downward, there is not much support to be found until 1.45 - 1.50, suggesting that there is a bit more downside for equities in store ...
Hang on! We have a potential price target for IEF, and we have two potential levels for the SPY:IEF ratio. This means that, using "reverse relative strength" and working backward we should be able to find some price targets for SPY based on these values.
I have introduced this approach as something I started to play around with in my blog of 10 January; "Price targets for SPY based on the relative strength of XLP" Let's apply the same math to the levels mentioned above.
RS = SPY / IEF
1.5 = SPY / $ 110
SPY = 1.5 * $ 110 = $ 165
WOW!! $ 165 ... again... The price target that I arrived at by applying this to the XLP:SPY ratio in the blog mentioned above was $ 165.38 ... Not sure what you think about this, but I think it is fascinating! Please drop your thoughts in the disqus comment section below!
Once again, please note that this approach is not backed up by anything else than a thought in my head, but I will keep you posted on how it develops and when the brainwave comes ... ;)
Julius de Kempenaer | RRG Research
RRG, Relative Rotation Graphs, JdK RS-Ratio and JdK RS-Momentum are registered TradeMarks by RRG Research
Follow RRG Research on social media:
LinkedIn Facebook Twitter


