Wow, what a start of the new year! Increased volatility sounds like an understatement.
In my previous blog on sector rotation in the US equity market, the Consumer Staples sector (XLP) popped up as potentially interesting, especially in relation to its counterpart consumer discretionary. Since the start of the new year, it looks as if this improved sector rotation is beginning to materialize for XLP in general and more specifically against Consumer Discretionary (XLY).
In this post, I want to build on the further improvement of XLP and use developments on the XLP price chart and the relative strength of the sector to arrive at a price target for the broader market as represented by SPY.
Summary
- XLP - Consumer Staples "hooking up" towards the leading quadrant again
- only four sectors on the right-hand side of the RRG (XLI, XLY, XLP, and XLK)
- Contradiction between price and relative strength of XLP just got a bit stronger
- Reverse Relative Strength Calculation gives price targets for SPY at $ 182 or $ 165
At sector level
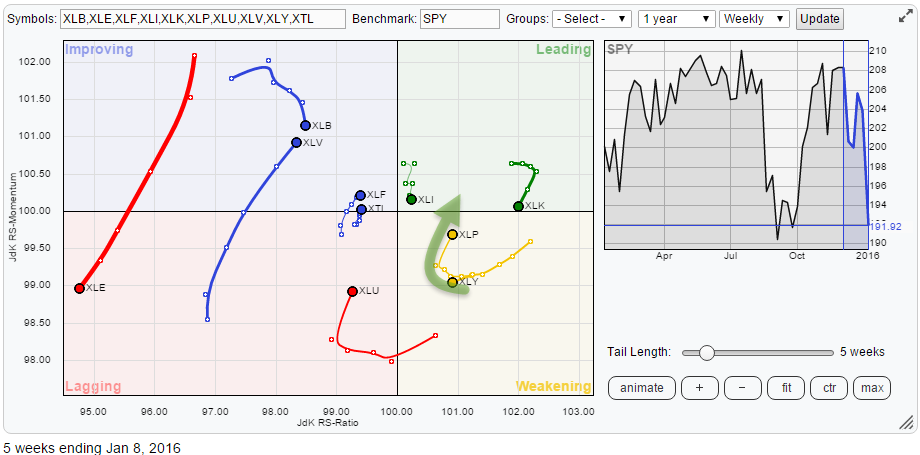
Starting at the Relative Rotation Graph showing the sector ETFs that make up the entire S&P 500 universe we can see that over the past few weeks XLP "hooked" upward while still being inside the weakening quadrant. What this means is that XLP is, still, in a relative uptrend against SPY, which started back in August 2015. After rotating through the leading quadrant, XLP began to lose relative momentum causing the JdK RS-Momentum line to drop below 100 and make the sector moving into the weakening quadrant on the RRG.
This in itself is not necessarily negative as such, especially when the crossover occurs while the sector is still high on the JdK RS-Ratio scale. Very often such a dip in momentum is simply a high-low rotation in the raw RS-line measuring the relative strength of XLP against SPY. Only when such a move accelerates, identifiable by long tails, and clearly starts heading towards the lagging quadrant, chances for the relative uptrend to turn into a relative downtrend are increasing.
Looking at the RRG above, reading from the JdK RS-Ratio scale, you can see that XLP is the 2nd or 3rd (competing with XLY) strongest sector in the universe at the moment. Only XLK, XLY, XLP and XLI are on the right side of the plot and therefore, judged to be in relative uptrends against SPY. Out of these four, XLP is the only one moving higher on the JdK RS-Momentum scale again. This means that the relative uptrend just went through a corrective move but recently started to move in the right direction (up) again. The other three are the opposite, they are in relative uptrends but going into or through a correction within that uptrend. The further away from the benchmark, i.e., higher on the RS-Ratio scale, the stronger the trend. Following this reasoning, XLK is the strongest sector in this universe now, and the position of XLI is a bit questionable as it is very close to the 100-level and more moving in line with the benchmark.
Consumer staples - XLP
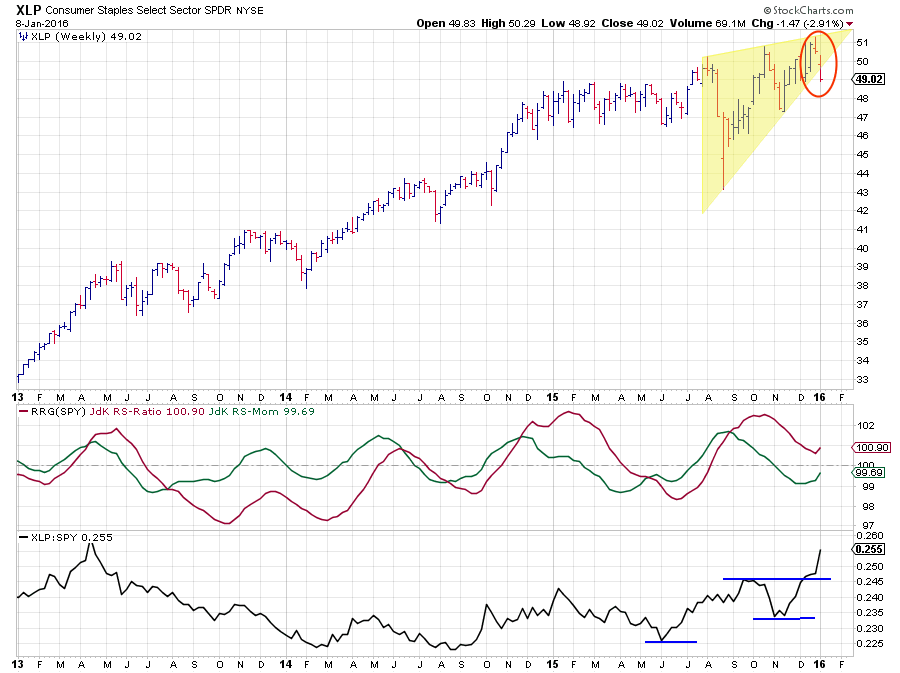
The price chart, in combination with the relative strength lines, is showing a contradicting picture as explained in the previous blog. And this contradiction even got stronger following last week's performance.
The rising wedge pattern seems to be breaking to the downside that is a negative signal and usually triggers a further decline towards the base of the formation, which, in this case, would translate to levels around $43. However, we can expect a battle for support as there is still the rising trendline, emerging from the 2009 lows; that is still in play and marking the lower boundary of the rising channel (see XLP/XLY chart below). This line currently comes in at levels between $ 47.50 - 48.00.
The question, therefore, is which support level will be able to catch a decline in XLP?
The relative charts, on the other hand, just got more positive. On the chart of the raw RS-Line in the lower pane, we can see that relative strength now clearly steered away from the horizontal resistance level, which was offered by the previous peak, and is starting to accelerate. This move has caused the JdK RS-Momentum line and the RS-Ratio line to turn around again, where the RS-Ratio line is doing that while still above 100. When the RS-Momentum line crosses above the 100 level, the sector will rotate back into the leading quadrant, suggesting a continuation of the existing uptrend in relative strength.
A basic technical analysis rule says that one can add the "height" of a range or a prior move to the breakout level in order to arrive at a preliminary or minimum target for the next move. In the case of the relative strength of XLP versus SPY, this would mean adding 0.0135 ( 0.2460-0.2325 ), to the level of the breakout. This sets a target for the relative strength line near 0.26 which coincides with the peak in relative strength back in 2013.
Staples vs. Discretionary XLP / XLY
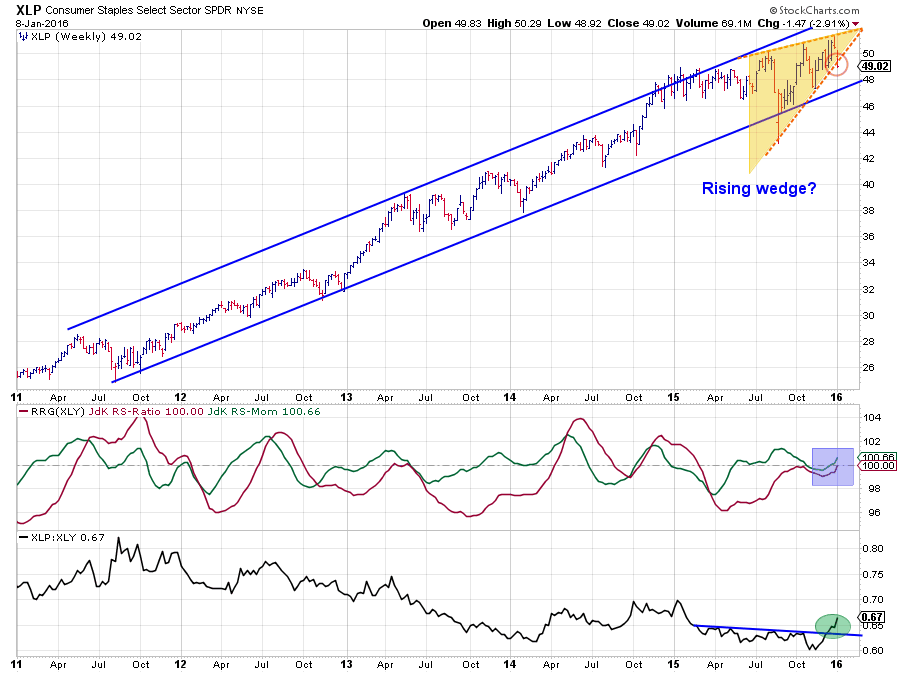
The chart above is the updated chart showing the relationship between XLP and XLY. The improvement of XLP over XLY is becoming more and more apparent. Hence, Staples are expected to continue to lead Discretionary as well as the general market (SPY).
Implications for the general market
Now, the assumptions and the case built about the (out-) performance of the Consumer Staples sector against SPY can be used to work out an expectation or a scenario for SPY as well.
Given the steady improvement of relative strength against the broader market (SPY) and the expectation of further outperformance for this sector implies that SPY will have to drop more than XLP actually to make this happen! When the rising support line in XLP is strong enough to catch the decline, the damage for Staples will be limited to 3% and SPY will have to decline more than 3%. If XLP drops further and reaches support based on the rising wedge pattern, Staples will have lost 12.2%. In that case, SPY is expected to fall even further.
Reverse relative strength calculation
Relative Strength or raw-RS as I use to call it is calculated using this formula:
RS = XLP / SPY
Using some basic math we can rewrite this formula as follows:
XLP = RS * SPY
or
SPY = XLP / RS
Therefore, assuming a target around 0.26 for the raw RS-Line of XLP vs. SPY and a target of $47.50 for XLP we can calculate a target for SPY:
SPY = $ 47.50 / 0.26 = $ 182.69
If our first support level does not hold and the target based on the rising wedge, $ 43.00, will come into play the target for SPY can be pegged at:
SPY = $ 43.00 / 0.26 = $ 165.38
Let's see how that looks at the chart of SPY itself.
S&P 500 SPDRS - SPY
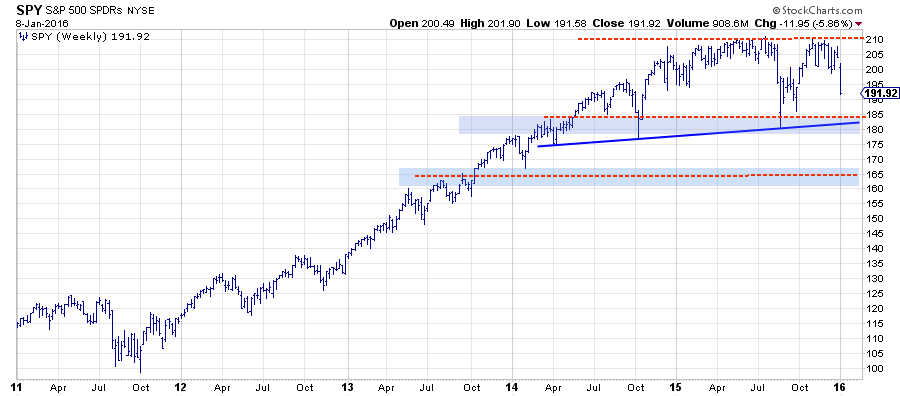
A lot of my fellow authors on the site have written about the technical condition of the general market so I won't bother you with another copy of a similar opinion. What I'd like to to is put the calculated price targets for SPY, based on the "reverse RS calculation," into perspective on its chart.
The first target, based on the assumption of support at $ 47.50 holding up, came in around $ 182-183. Looking at the chart above this seems to be an area where a number of support levels are clustering together. The lower boundary of a range that can be seen between $ 185 - 210, a support line connecting the extreme lows since early 2014 and the lower end of a support zone running through some high-low clusters over the past two years. Seems like an important area to watch in the weeks to come.
If SPY reaches this area, it will have fallen roughly 4.8% from current levels which is more than the 3% decline for XLP when it reaches its $ 47.50 support level.
The second target for SPY, based on the assumption of support at $ 43.00 being reached in XLP, was pegged around $ 165. Again, looking at the SPY chart, this seems to be an area of support, albeit not as pronounced as the first. Around $ 165 we see some highs and lows that were formed late in 2013 and early in 2014. As if and when SPY will reach that area it will have fallen 14%, also underperforming the minus 12.2% for XLP in this scenario.
All in all, it looks like SPY will have some more declines ahead in coming weeks. Working backward from the assumption that the Consumer Staples sector (XLP) will reach support levels at $ 47.50 or $ 43, price targets for SPY can be calculated around $ 182 or $ 165 using reverse relative strength calculations.
Note
Please note that I have just started to play around with the approach of using reverse relative strength calculation to get a handle on moves in the general market and I thought I'd share it with you. Obviously with a comparison that involves three variables you need to assume or estimate two in order to get to the third. This means that a lot of things can happen causing the calculated target to be void. Nevertheless, the approach should be able to give us a handle. Please drop your ideas, views, comments etc. in a comment below.
Julius de Kempenaer | RRG Research
RRG, Relative Rotation Graphs, JdK RS-Ratio and JdK RS_Momentum are registered TradeMarks by RRG Research
Follow RRG Research on social media:
LinkedIn Facebook Twitter


