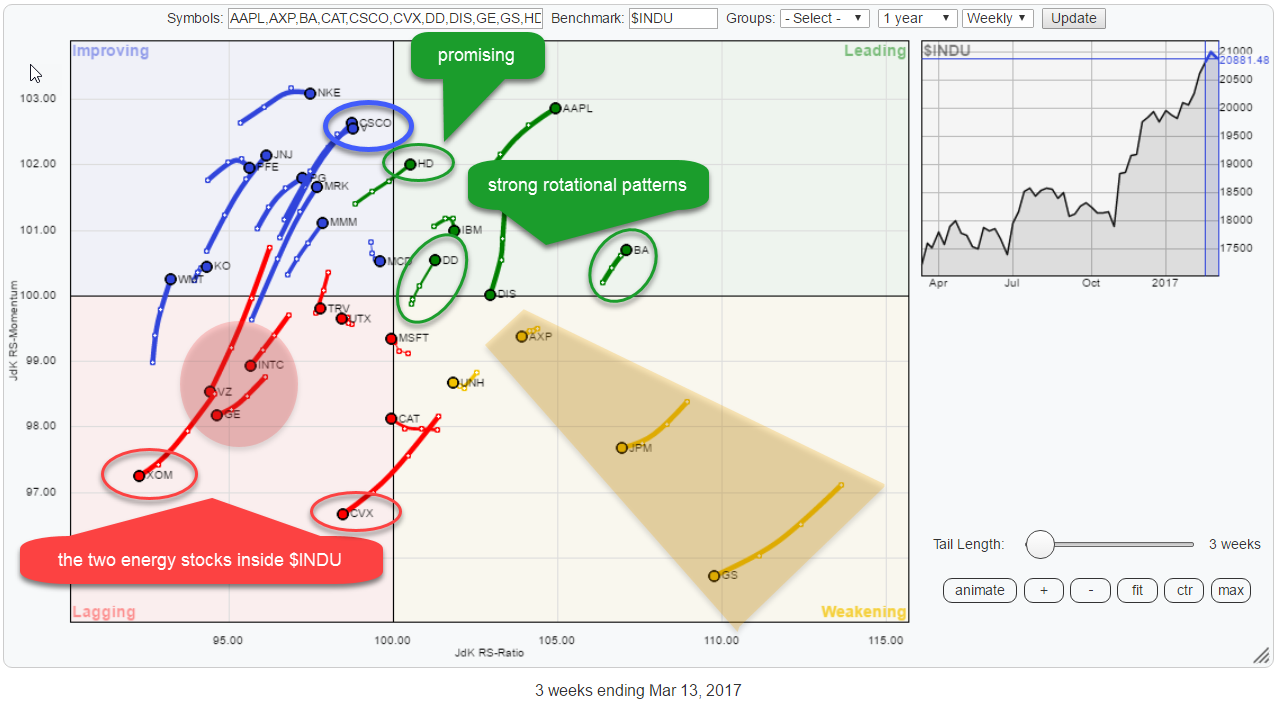
 ... And they both show very weak rotations on the Relative Rotation Graph of the DJ Industrials components.
XOM rotated negatively while inside the lagging quadrant and CVX just crossed over into the lowe-left part coming from weakening. These are the two names to avoid in this universe.
They are closely followed by the stocks in the red-shaded area, VZ, INTC, and GE.
Inside the improving quadrant, there are a few names that stand out. These are V and CSCO inside the blue circle. Both show good RS-momentum and improvement on the RS-Ratio scale.
This week HD crossed over from improving to leading which makes it a stock to investigate further, but V and CSCO are also worth looking at.
In the leading quadrant, besides AAPL, which was covered in the previous RRG article on the $INDU universe, BA and DD are worth a further look as they are re-entering the leading quadrant from weakening.
Within the weakening quadrant, financials continue to dominate, in a negative way, and they are nicely lined up for a further rotation towards lagging.
Summary
- Very weak rotation for XOM and CVX
- V and CSCO show promising rotations inside improving quadrant
- HD entry into leading has potential
- Re-entries into leading for DD and BA look strong
- BA one of the strongest, if not THE strongest stock in $INDU universe
Energy is weak as a sector
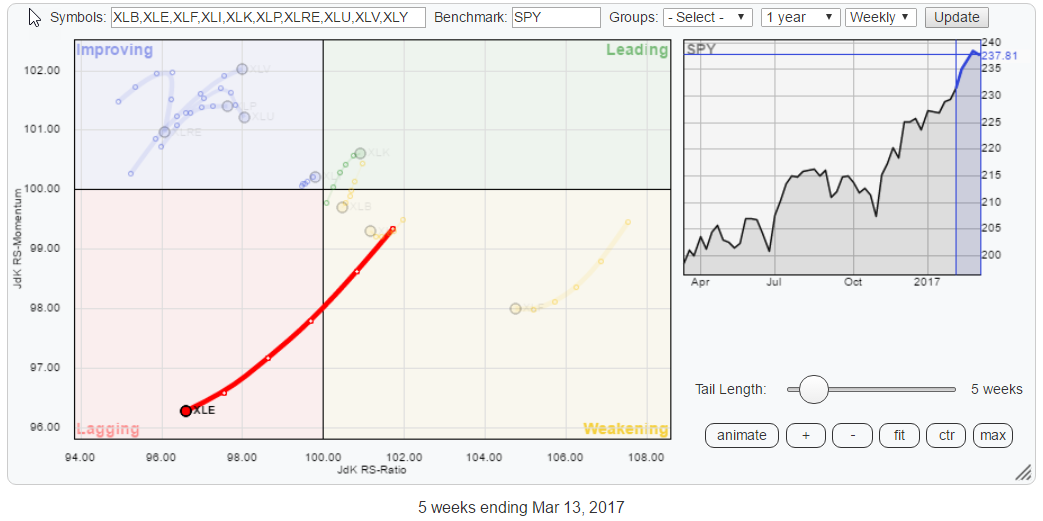 On the Relative Rotation Graph for US sectors, XLE (Energy) immediately catches the eye for its long tail and strong move into the lagging quadrant. At the moment it is the only sector inside the lagging quadrant.
As we all know it is far more important to avoid bleeders in a portfolio than to focus on picking the NBT (next big thing).
The Relative Rotation Graph above cannot be clearer in sending the message which sector to avoid.
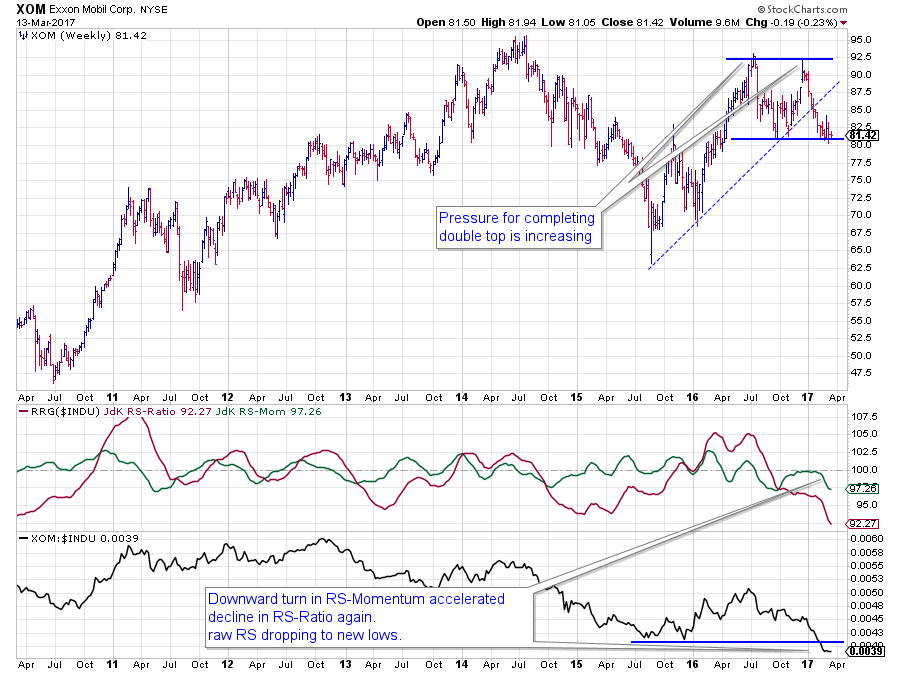
EXXON Mobile Corp. - XOM
The stock price of XOM is, back, at the level of early 2016 (and late 2015). I don't need a chart, price-, relative-, or RRG-, to know that this means a strong underperformance against the general market. And I hope you don't need a chart to make that assessment either.
But they come in handy when we want to analyze the trends and their potential developments going forward.
On the price chart, XOM broke its rising support line at the beginning of this year and is now resting at a support level offered by the previous low around $ 80.
A break below this support level will complete a double top formation and very likely set off an acceleration in the decline, pushing XOM even further down, potentially, towards its next support level around $ 70.
The relative charts are where the real problem shows up. The relative strength started to weaken during the summer of last year. This weakening if the relative trend was picked up by the RRG-Lines which positioned XOM inside the lagging quadrant.
A brief hiccup in relative momentum (RS-Momentum) pushed XOM towards the improving quadrant again, but the stock never managed to cross over, and RS-Momentum rolled over around the 100-level pushing XOM back into the lagging quadrant where it is now the weakest stock inside the DJ Industrials index and still pushing deeper into it.
Chevron Corp. - CVX
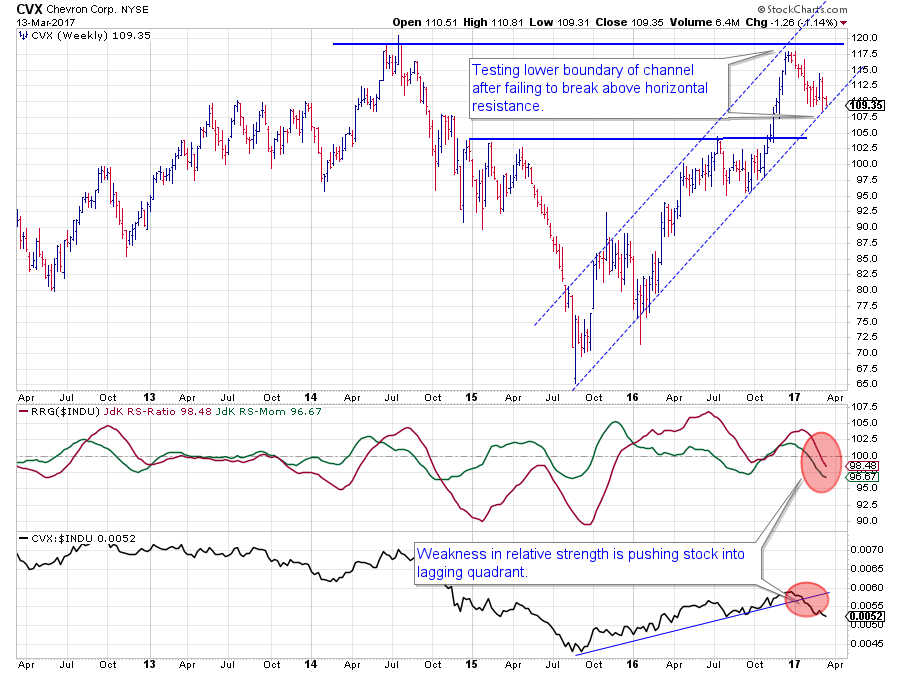 CVX is the second energy stock in this universe. The price chart is in a bit better shape than XOM with the price still inside the rising channel and currently resting at support.
If this rising support holds up, there will be a major barrier waiting around $ 120 where two peaks were formed. Clearly, a break higher will be positive but based on the sector strength (or better weakness) and the condition of the relative trend of CVX against $INDU the odds seem more in favor for a break of support in coming weeks.
While price is still resting at support, relative strength is not. The raw RS-Line broke a rising support line, already at the beginning of this year.
The JdK RS-Momentum line crossed below 100 almost at the same time of the break and RS-Ratio has recently followed the RS-Momentum line below 100, signaling a new downtrend in relative strength.
The recent decline of the JdK RS-Ratio line below 100 pushed CVX into the lagging quadrant backed by a long tail, suggesting that there is enough power behind this rotation to drive CVX further into the lagging quadrant, underperforming the DJ Industrials performance in coming weeks.
Entry and Re-entries into the leading quadrant
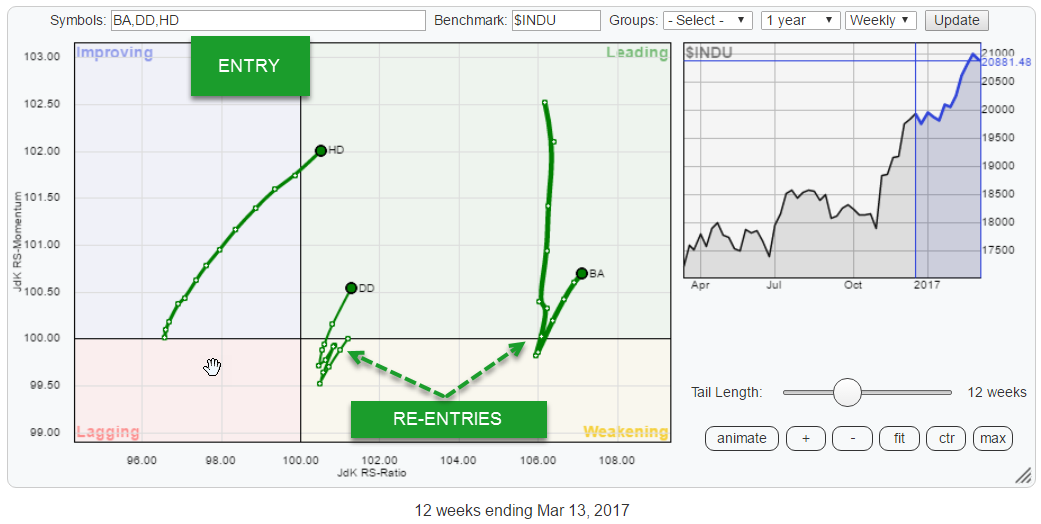 On the first Relative Rotation Graph at the top of this article, I highlighted three stocks. HD, DD, and BA.
Out of these three, HD enters the leading quadrant from improving after a rotation through lagging. DD and BA, on the other hand, are re-entering the leading quadrant after a rotation, albeit brief, through the weakening quadrant.
From research and eye-balling a lot of Relative Rotation Graphs, we know that such re-entries, after completing a rotation on the right-hand side of the plot usually have positive implications and follow through. They often mark the second leg higher in an already established relative uptrend.
Home Depot, Inc. - HD
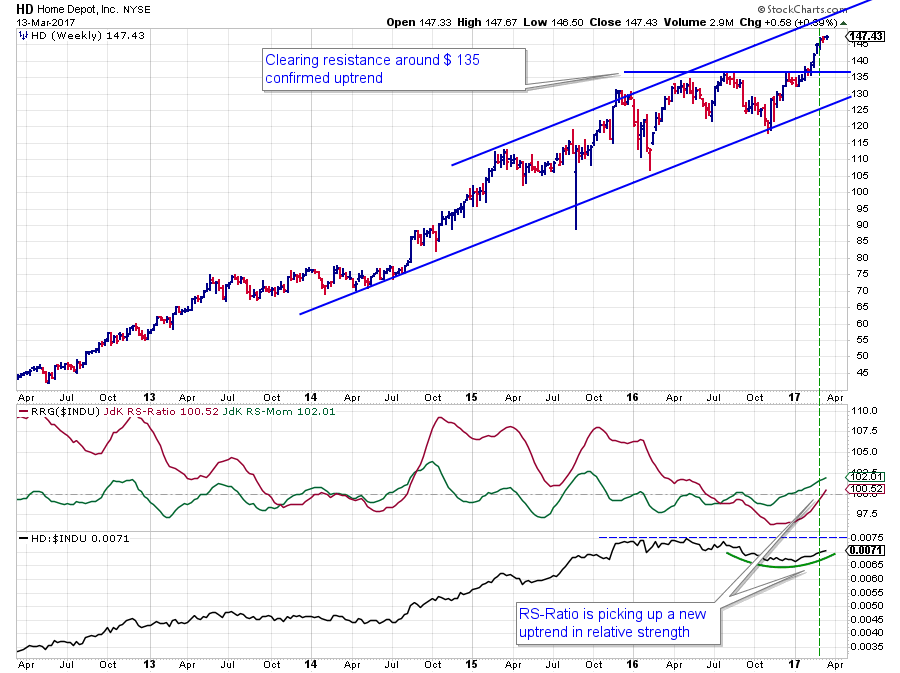 HD spent most of 2016 between $ 120 on the downside and $ 135 on the upside. A few weeks ago, this situation changed when HD convincingly cleared the horizontal barrier at $ 135 and rapidly rallied further to its current levels around $ 147.
Relative strength against $INDU is now starting to pick up on this improvement as well. The RRG-Lines are now both positioned above the 100-level which puts HD inside the leading quadrant.
Reading from the RRG, you can see that HD spent quite some time on the left-hand side of the chart, both RRG-Lines below 100. Moving from 2016 into 2017 the RS-Momentum line crossed above 100, putting HD inside the improving quadrant. Just recently the RS-Ratio line also crossed above 100 again, pushing the stock into the leading quadrant from improving.
On the raw RS-Line, the improvement is not yet that visible. Relative strength has not been able yet to take out the horizontal overhead resistance and is currently curling upward. A bit more, aggressive, confirmation from the RS-Line would be nice to keep the current rotation going and give it a bit more credibility but for the time being the improvement against $INDU is on the right track and seems to continue.
DuPont Co. - DD
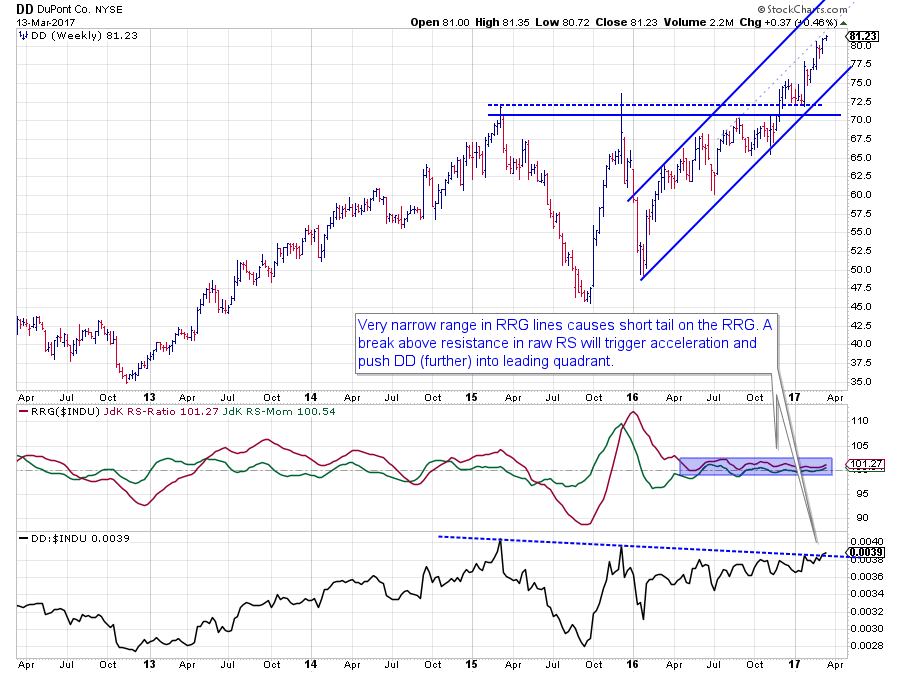 The RRG-Lines for DD against $INDU show a remarkable pattern. Since April 2016 both lines, the JdK RS-Ratio line as well as the JdK RS-Momentum line moved almost flat and very close to the 100 level. This type of movement indicates a performance more or less in line with the benchmark, in this case, the DJ Industrials index, and cause a short tail on the Relative Rotation Graph.
Some sort of spark is needed to re-ignite the fire in the relative performance of DD again.
The price chart is looking healthy, the uptrend inside the rising channel is intact and after clearing resistance between $ 70 - 72.50 DD is gunning for the upper boundary of its rising channel.
The "spark" that we need looks to be around the corner as the raw RS-Line seems to be breaking above its, almost, horizontal resistance level. If the market can clear this overhead barrier in relative strength for DD a stronger push into the leading quadrant and outperformance of the DJ Industrials index is expected going forward.
As the JdK RS-Ratio line is already moving above 100 since late 2015, the oscillations of the JdK RS-Momentum line around the 100-level are causing rotations from leading through weakening and back again. These re-entries into the leading quadrant after a rotation through weakening are usually signs of, relative, strength.
A clear break above resistance in the RS-Line will likely serve as the awaited catalyst. The tail on the Relative Rotation Graph is already pointing in the right direction.
Boeing Co. - BA
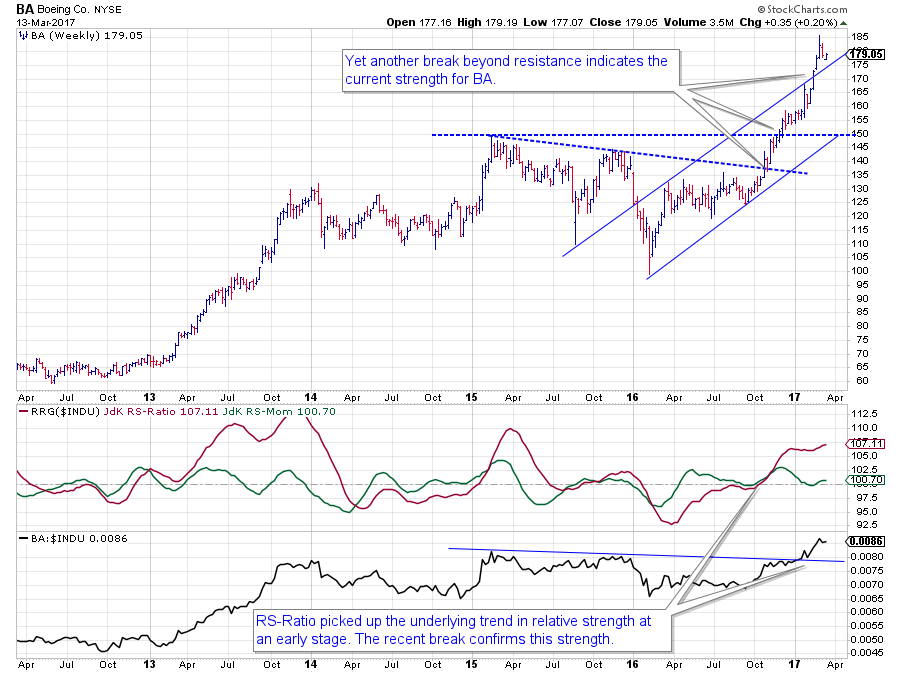 After take-off in October 2016, BA is still ascending and has not yet reached cruising altitude, or so it seems.
On the price chart, the stock broke some important resistance levels, each followed by a further steepening of the flight path. Very recently BA even managed to break above the already rising resistance line which marks the upper boundary of the rising channel.
And yes this could be a blow-off, but also yes it is a sign of strength and until signs of weakness start coming in it is better to follow the trend higher as you might miss a nice move higher.
Just like markets can remain irrational longer than you can remain solvent, they can also remain irrational longer than you will be able to keep a cash position.
The uptrend in relative strength was picked up by the RRG-Lines in October. After an initial strong rotation inside the leading quadrant, RS-Momentum started to roll over and go through a decline bringing it back to the 100-level.
BA was not able to make a low pass, fly-by, above 100 but needed a touch and go, briefly touching the weakening quadrant, but after that, the stock is now at full-throttle with its nose up again! Currently, it is one of the best, if not THE best stock inside the DJ Industrials Index.
Julius de Kempenaer | RRG Research
RRG, Relative Rotation Graphs, JdK RS-Ratio and JdK RS-Momentum, are registered TradeMarks by RRG Research
Follow RRG Research on social media:

