 Watching the 30 members of the Dow Jones Industrials index on a Relative Rotation Graph always provides a great insight into what's going on under the hood of that universe.
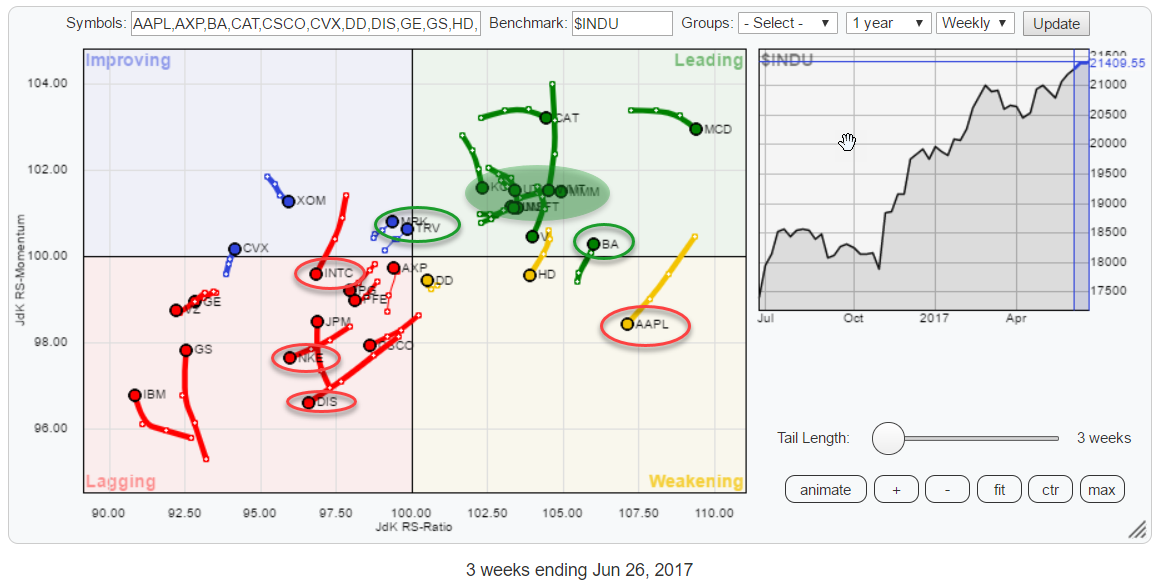
The first quick takes from the graph above are a fairly evenly spread universe with no big outliers and AAPL heading into the weakening quadrant while still at the second highest JdK RS-Ratio reading. Also on the right-hand side of the RRG, we find BA moving opposite of AAPL into the leading quadrant from weakening, these are usually strong relative moves.
Inside the leading quadrant, there is a bit of a cluster of stocks all moving closer together which I will zoom into a bit more to see if anything interesting is going on there.
The tails that grab attention inside the lagging quadrant are INTC, NKE, and DIS. NKE and DIS are shooting deeper into the lagging quadrant for a few weeks already while INTC just rotated back into the lagging quadrant after a short rotation through improving.
Very close to the benchmark (center of the chart) are MRK and TRV with very short tails but positive RRG headings and close to crossing over into the leading quadrant.
Summary
- $INDU showing evenly spread universe on RRG
- AAPL still strong but rotating into weakening
- BA rotating opposite to AAPL into leading from weakening
- INTC showing weakness on weekly as well as daily RRGs
- TRV ready to cross over into leading after a period of quiet
Clustered inside leading quadrant
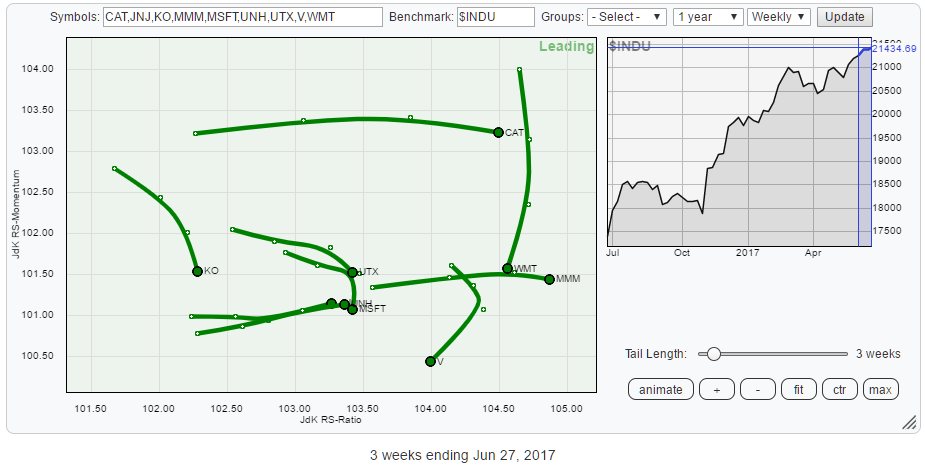 Inside the leading quadrant, some stocks are clustering together which requires a bit of zooming to see what's going on there.
Losing relative momentum (declining on the JdK RS-Momentum scale) are WMT, KO, V, and MSFT. These stocks are still in a relative uptrend against the DJ Industrials, but the strength of the trend is starting to lose power (Momentum).
The other stocks in this, zoomed in, picture are CAT, UTX, MMM, UNH and JNJ their tails are almost horizontal which means that they are continuing their relative trend higher against $INDU at a stable pace (Momentum). Just reading from the RRG without inspecting the individual charts my preference would be for UNH and JNJ as their tails are at least pointing slightly higher on the JdK RS-Momentum axis as well while there is still room to gain more on the JdK RS-Ratio scale.
A closer inspection
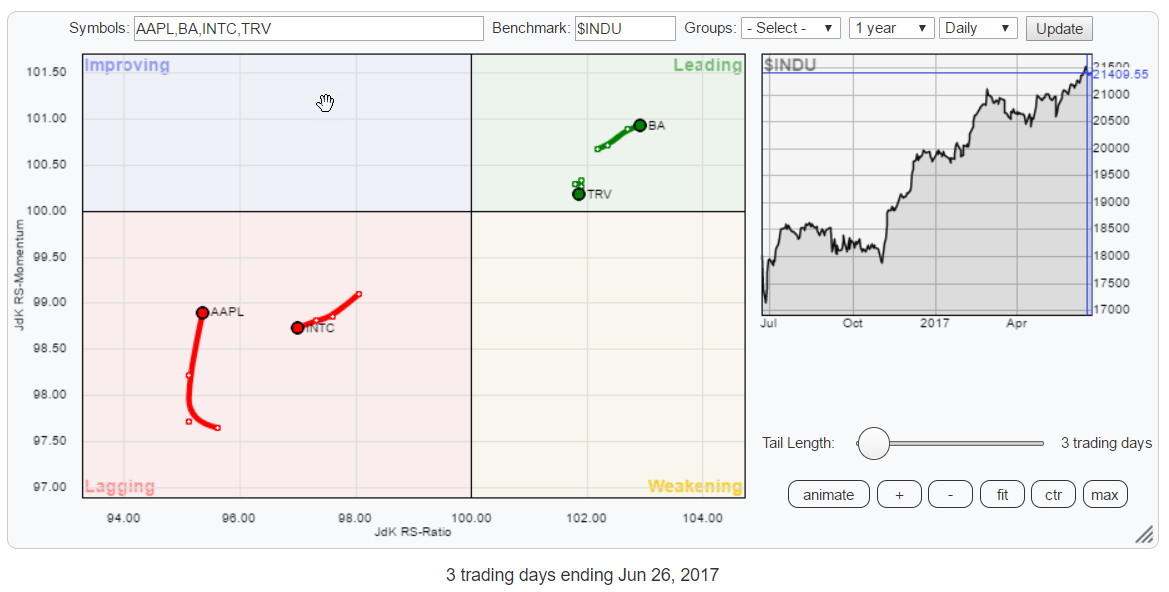
The stocks that I picked, for a closer inspection, from the weekly RRG above are AAPL, INTC, TRV, and BA.
The RRG below shows these stocks on a daily time frame so I can relate the daily vs. the weekly rotation and see if the confirm or contradict each other.
Apple Inc. - AAPL
Apple has been on a roll for more than a year now, and technically it still is!
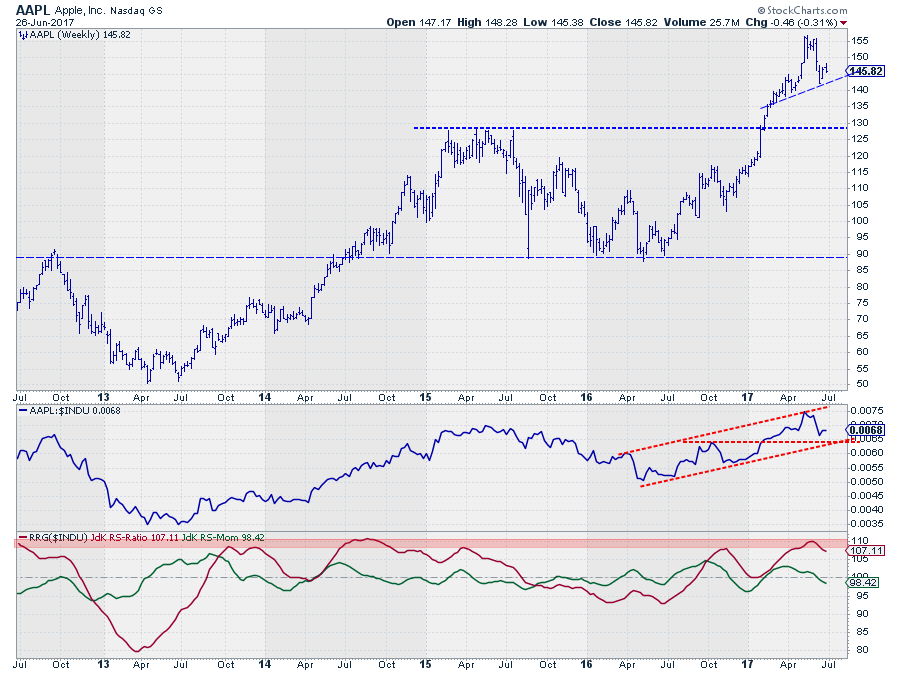
From the lows around $ 90 in the first half of 2016 AAPL rallied to a high around $ 155 a few weeks ago. During this rally, the stock price took out the major resistance level of the previous highs around $ 130. This area around $ 130 is now the most important support area to watch as support on the way down.
A downward break below the short term (dashed) support line will likely serve as a trigger for a test of that support area.
The RS line of AAPL against the DJ Industrials Index is moving higher in an up sloping channel which is still intact. Since September last year, the RS-Ratio line is moving above 100, indicating a relative uptrend. The dip of the RS-Ratio line back to, but not below, the 100 level caused the rotation on the RRG to complete at the right-hand side of the graph.
The most recent part of the rally in price has also pulled the RS-Line higher towards the top of its channel and RS-Ratio levels to the area where it peaked over the past five years. The fact that the RS-Momentum line has dropped below 100 indicates that a top has been formed in RS-Ratio and the combination of the two puts AAPL inside the weakening quadrant on the RRG now.
The good news is that AAPL, based on RS-Ratio readings, is still the second strongest stock in the index. If I combine this position for AAPL on the weekly RRG with the one on the daily RRG, it leads to the belief that the current loss of relative momentum for AAPL can very well be a temporary setback within the longer term trend.
On the daily time frame, AAPL has already rotated into the lagging quadrant and started to move higher on the RS-Momentum axis there. If this rotation continues positively, it will pull AAPL around at the right-hand side of the weekly RRG as well.
All in all the relative trend is still up for now but going through a correction. Very likely new re-entry opportunities will come up in coming weeks. I'll be on the lookout for AAPL to turn in an RRG-heading of 0-90 degrees on the weekly chart while still inside the leading quadrant.
Boeing Co. - BA
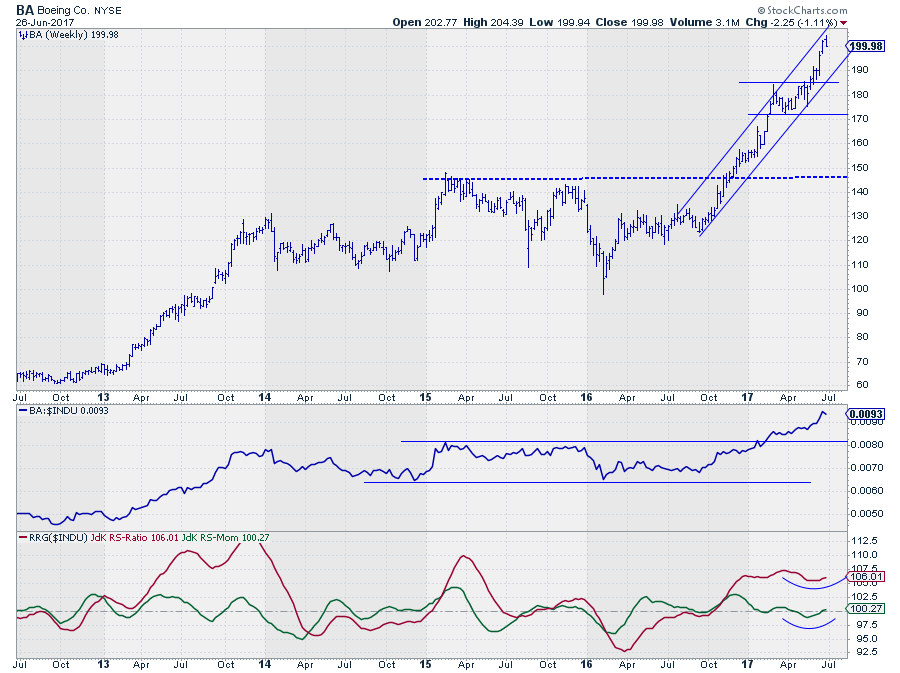
At the moment BA and AAPL are moving more or less exactly opposite of each other on the weekly RRG. AAPL, as we have seen is dropping fast on the RS-Momentum axis and just moved from leading into weakening. BA, on the other hand, is moving higher on the RS-Momentum scale and has just rotated back into the leading quadrant from weakening.
Both the price- and the relative charts, printed above look very strong. On the price chart, the rising channel is fully intact, and BA has plenty of room to correct without harming that trend.
On the relative chart, BA managed to continue its relative strength vs. $INDU after breaking the horizontal resistance coming off the 2015 relative highs. A small drop in the pace of the relative rally caused the RS-Momentum line to drop below 100 briefly, pulling RS-Ratio slightly lower, but this has now reversed, and the recent move back above 100 of RS-Momentum has caused BA to rotate back into leading from weakening which, we know, is usually a strong sign.
So between AAPL and BA, the preference at the moment should be for BA over AAPL
Intel Corp. - INTC
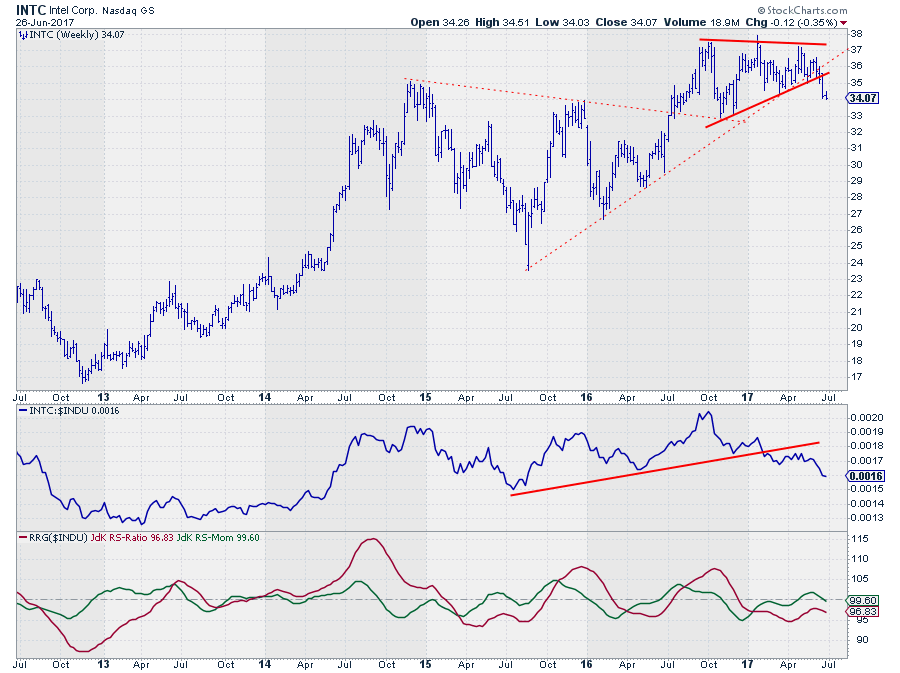 INTC grabs attentions on the weekly RRG where it just rotated from improving back into lagging. These are stocks that are in relative downtrends versus the benchmark, went through a temporary recovery and then resume their downtrend.
A quick look at the daily RRG reveals that in this time frame INTC is also inside the lagging quadrant and heading deeper into it at a negative RRG-heading. This is confirming the weakness that is spotted on the weekly RRG.
The price and relative charts printed above are not much better. The relative strength line broke its rising support at the beginning of this year while the JdK RS-Ratio line had already dropped below 100 at the end of 2016.
On the price chart, INTC managed to hold up above support until a few weeks ago when the symmetrical triangle that formed since the second half of 2016 was broken to the downside. This break now seems to start accelerating the decline for INTC which is also taking its toll on the relative charts.
Within the $INDU universe INTC now seems to be a stock to avoid.
The Travelers Cos., Inc - TRV
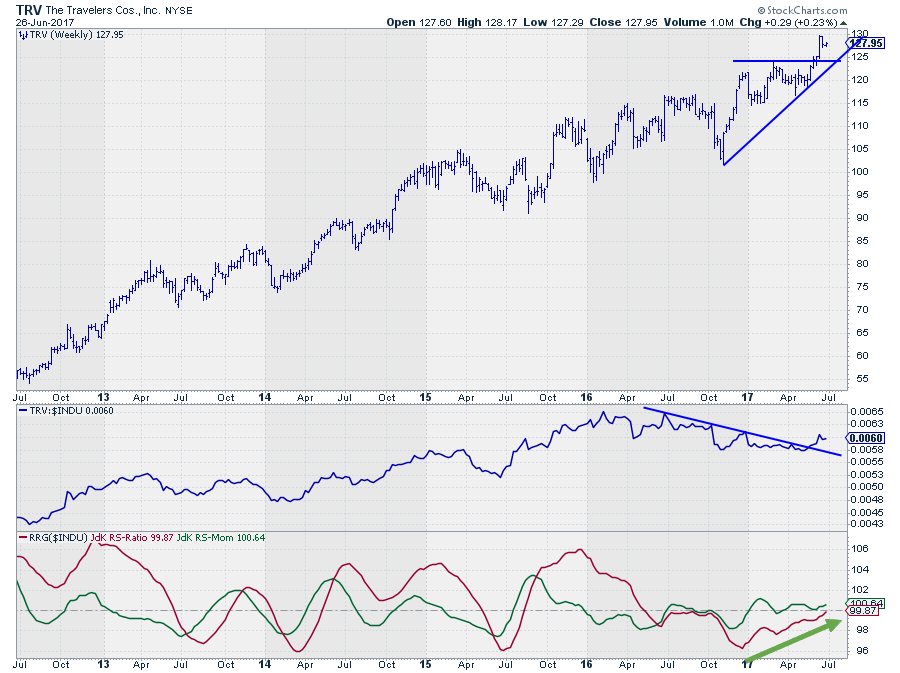 TRV shows an almost horizontal relative strength line since the beginning of this year. This indicates a performance almost identical to the benchmark. Hence not much opportunity to generate Alpha.
This resulted in the RRG-Lines to move back to the 100-level and remain there, causing a position close to the center of the Relative Rotation Graph.
What makes TRV worth a further inspection is the RRG-heading which is between 0-90 degrees, meaning TRV is gaining on both axes. Combining this observation with the recent break of the down sloping resistance on the RS chart as well as the break to new highs above horizontal resistance on the price chart suggests that there is a new move higher underway for TRV with plenty of upside from both a price point of view as well as relative.
The relative trend seems to be waking up for TRV.
Julius de Kempenaer | RRG Research
RRG, Relative Rotation Graphs, JdK RS-Ratio, and JdK RS-Momentum are registered TradeMarks by RRG Research
Follow RRG Research on social media:
If you want to discuss RRG with me on SCAN, please use my handle Julius_RRG so that I will get a notification


