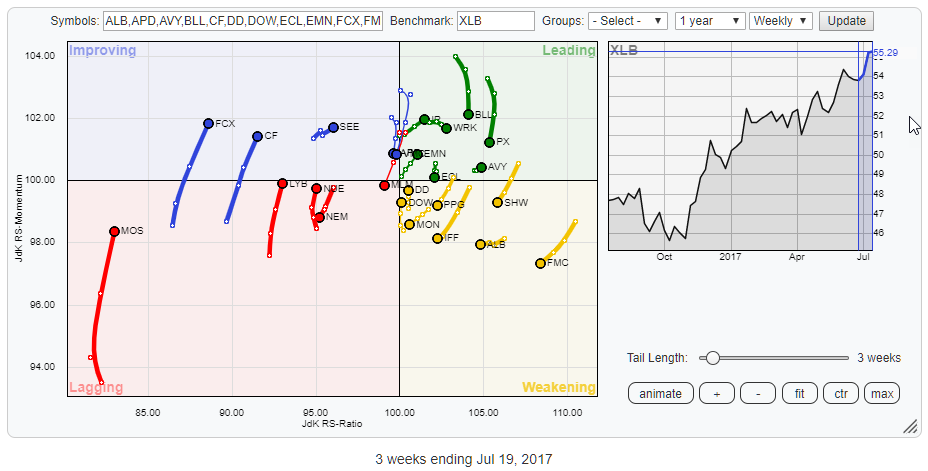
 The Relative Rotation Graph above holds the constituents of the Materials sector (XLB). The picture shows a fairly evenly distributed pattern with no real stocks standing out, maybe with the exception of MOS as it has the longest tail of all stocks on the graph while being at the lowest JdK RS-Ratio reading.
In my sector analysis in the previous blog, Materials and Financials were the only two sectors inside the improving quadrant. In that article, I focussed on XLF because of its long tail.
In this post, I want to take a better look at the members of the Materials sector especially as XLB just jumped away from its previous observation on the RRG and is now coming close to crossing over into the leading quadrant. Given the strong RRG-heading on the tail, there may be some interesting names to be found in the sector despite the fact that the sector itself is moving very close to the center of the RRG.
Summary
- Materials sector (XLB) rotating close to benchmark offering little opportunities for alpha
- Individual stocks inside XLB are a different story
- FCX and CF powering into improving quadrant on high-momentum move, early call for upside potential in CF
- Avoid MON and MLM as they are pushing deeper into the lagging quadrant
- EMN looks to be the stock to watch in this sector
From a sector perspective
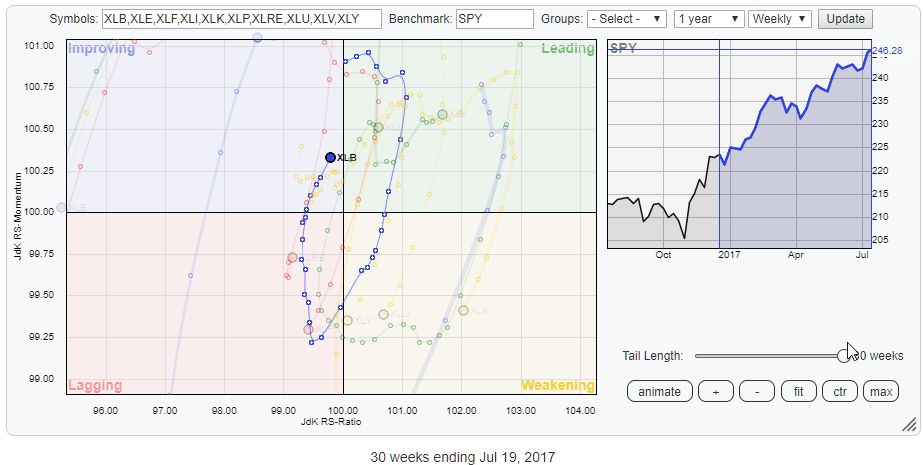
The XLB sector, on the RRG holding all S&P 500 sectors, completed a full rotation over the past 30 weeks while remaining close to the benchmark (the center of the chart). This indicates that over this period there has not been a lot of deviation from the performance of the S&P 500.
This is seen in more detail on the price chart of XLB below in combination with the RRG lines
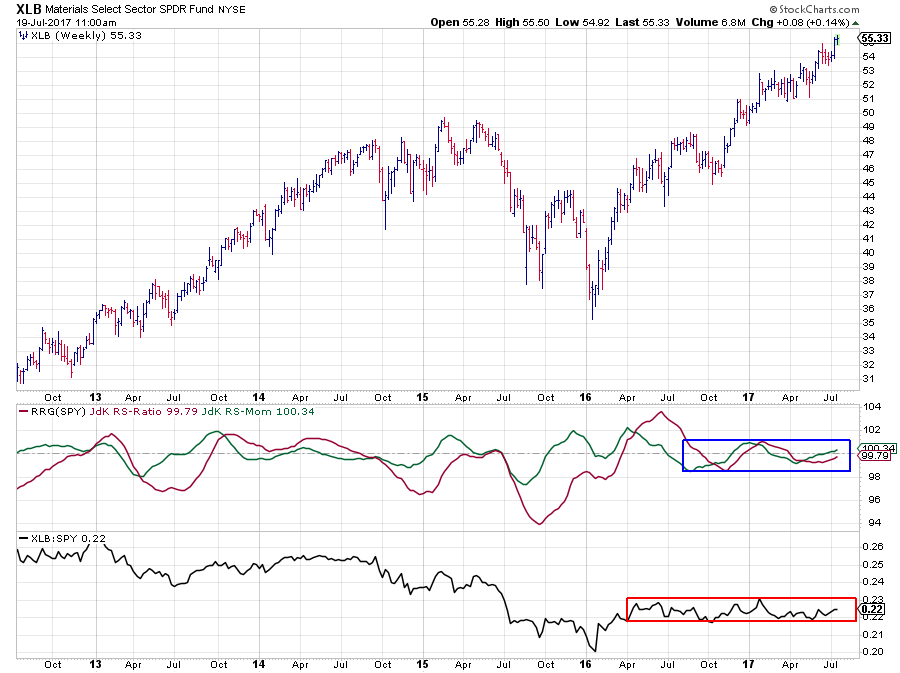 After the initial move higher in the beginning of 2016, the RS-Line started to level off and move flat within the boundaries of a tight range. The RRG-Lines responded to this move by retracting back to the 100 level and oscillate around that level in close proximity, causing the rotation close to the benchmark.
The fact that the sector, as a whole, moves in line with the index and offers little opportunity to extract alpha, does not mean that the individual stocks are not providing opportunities.
Zooming in
My usual routine is to "walk through" all the members on the RRG by selecting the lines of the individual stocks in the table below and stepping through the whole universe. This will highlight the selected stock and dim all others which allows me to better see the rotation of that specific stock while still being able to see the other members in the universe.
I pay attention to the position on the RRG, the length of the tail, the RRG heading etc.
On the RRG below I have picked the names that stood out for me for one reason or another and comment on a few individual charts.
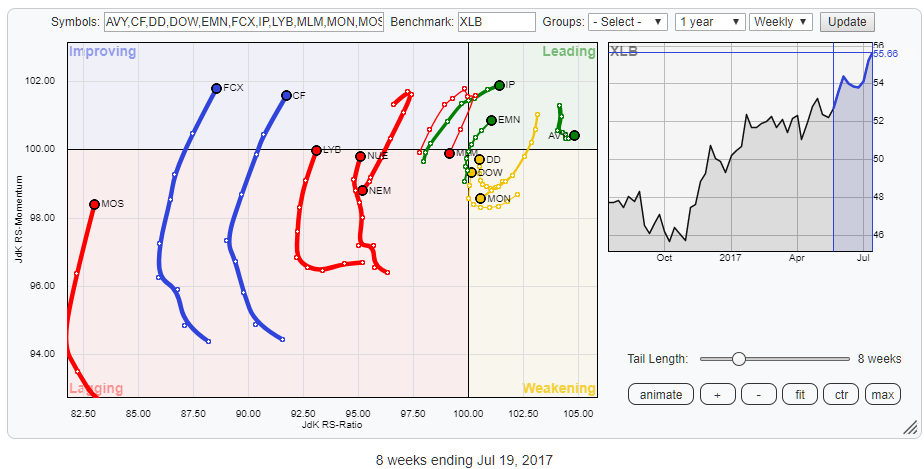
FCX and CF stand out for their long tails powering into the improving quadrant, the problem is that they are both still very low on the JdK RS-Ratio scale. Inside the leading quadrant, there are three tails that draw my interest. IP and EMN because of their positive RRG-Heading and AVY because of the slow down in (negative) relative momentum and turning towards higher reading on the RS-Ratio scale again.
Inside the weakening quadrant, MON stands out for its long tail heading rapidly towards the lagging quadrant. DD and DOW are interesting because of their turn back up without hitting the lagging quadrant. These turns back to a positive RRG-Heading while inside the weakening quadrant always seem to hold value.
There are a few tails in the lagging quadrant worth looking at. Clearly, the ones that have turned up and are pointing higher like MOS, LYB, and NUE. After a quick inspection of their price charts, I decided not to spend much time on them but focus on the two tails that rotated back down towards and into the lagging quadrant from improving. These are NEM and MLM.
Monsanto Co. - MON
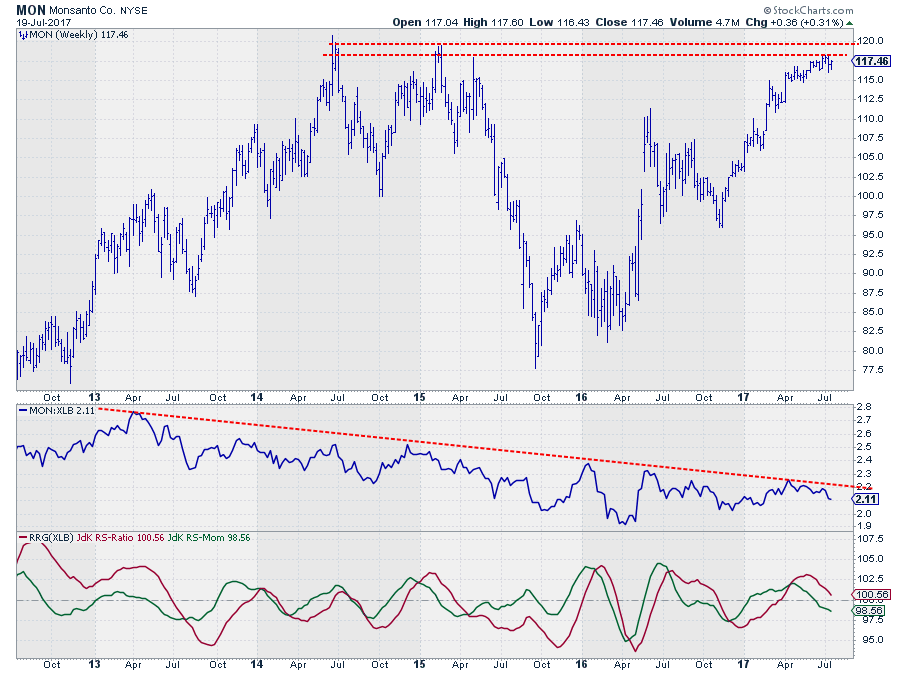 The RS-Line of MON against XLB is in a big downtrend for over four years already. Some intermediate rallies/improvements caused the RRG-Lines to cross above 100 and put MON inside the leading quadrant but it never lasted very long.
The recent improvement of relative strength which is visible in the beginning of 2017 ended once again against the falling resistance line and a new lower high in relative strength is in the making.
The weakness since April pushed RS-Momentum below 100 already and it seems only a matter of time before RS-Ratio will confirm the new period of underperformance.
Martin Marietta Materials - MLM
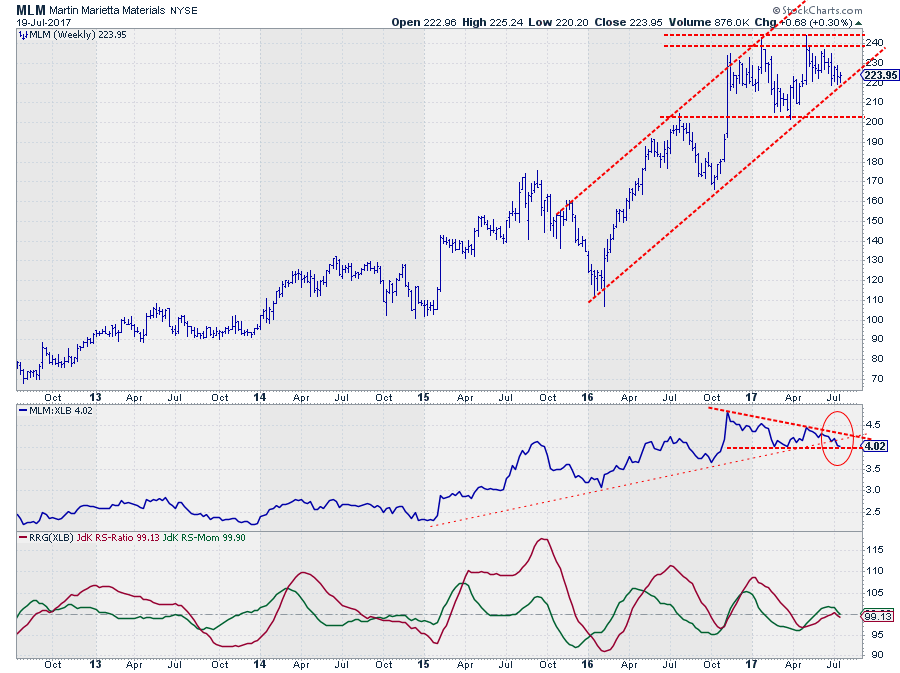 Relative strength for MLM has been moving higher since early 2015 with some intermediate dips and accompanying rotation through the weakening and lagging quadrants on the RRG.
In the RS chart (middle pane) it looks as if the rising support line is getting broken at the moment and since late last year a (descending) triangle formation seems to be tracing out. A break below the horizontal support level will very likely trigger a further acceleration lower.
On the price chart, MLM is still within the boundaries of the rising channel but the last rally did not manage to break beyond resistance offered by the previous peak, causing the trend to stall, and the area around $ 240 to become serious resistance.
The JdK RS-Ratio line has peaked AT the 100 level and is moving down again causing the rotation to move into the lagging quadrant suggesting that a new period of underperformance is underway.
CF Industries Holdings Inc. - CF
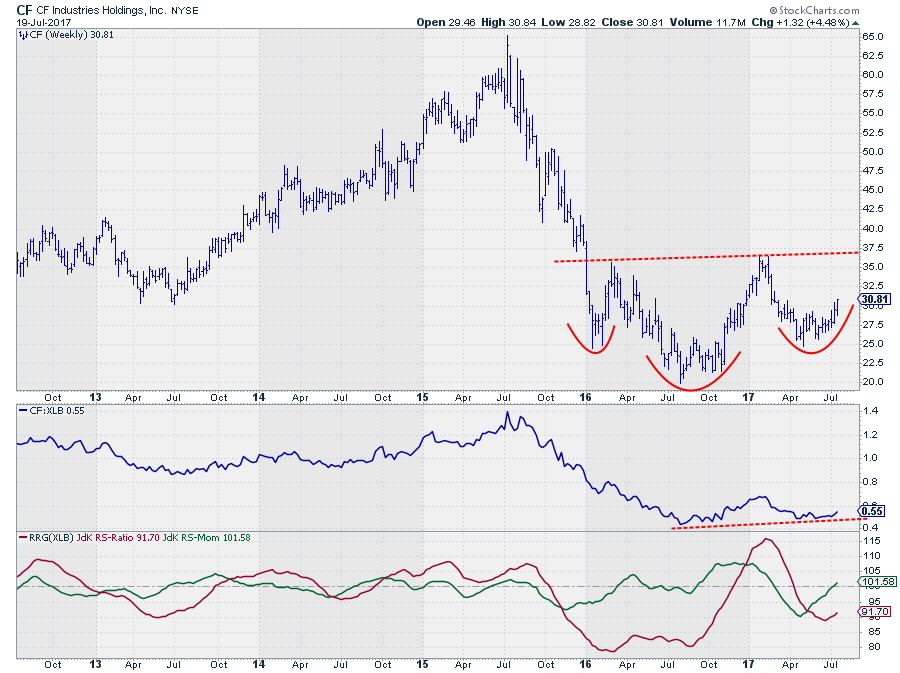
On the RRG, CF is powering higher into the improving quadrant together with FCX predominantly driven by positive relative momentum. However, both are still low on the RS-Ratio scale which makes it an early call.
A look at the price chart shows that the worst seems to be over for CF after dropping from $ 65 to a low around $ 20. An initial move higher out of the $ 20 low stranded around $ 37.50 where we now see resistance. The positive takeaway from this chart is that the subsequent low was formed higher, around $ 25, indicating that buyers are returning and willing to pay a higher price.
With a bit of fantasy, a big H&S pattern in the making can be detected as illustrated in the chart. It is an early call and the neckline near $ 37.50 needs to be broken for this pattern to complete. For the time being a simple continuation of the current move towards that neckline already offers some decent upward potential.
The relative strength charts are starting to support a more bullish outlook with the raw RS-Line bottoming out at a slightly higher level, indicating that the (strong) downtrend is coming to an end.
The resulting RRG-Lines are starting to respond with JdK RS-Momentum already above 100 and RS-Ratio just starting to move upward.
As said, all in all, it is an early call but the combination of price and relative strength and the rotational pattern on the RRG seems to offer good risk/reward on the long-side. First up to resistance near $ 37.50, and in case that level is taken out even higher.
Eastman Chemical - EMN
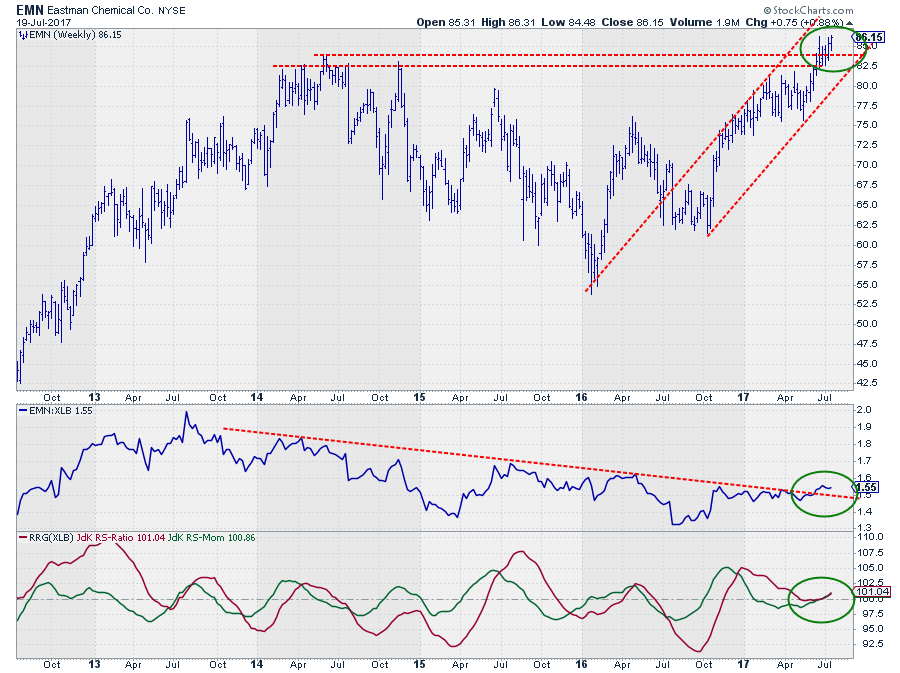 Out of the three names that I highlighted inside the leading quadrant, I want to show the EMN chart as I feel this one has the best potential. AVY is in a strong uptrend for a long time already and definitely has potential to move (much) higher but it is becoming a riskier trade every day it moves higher. IP is also a strong stock for sure and breaking out to new highs in price but on the raw RS-Line, IP is still struggling to take out the previous peak which could a bit of pressure on it.
EMN seems to have the best of both worlds at the moment. On the price chart, EMN is now convincingly moving higher after a few weeks of hesitation around the horizontal barrier around $ 82.50.
In the RS-chart the long standing downtrend is coming to an end with the break above the three-year-old, falling resistance line, causing the RRG-Lines to turn around and move higher in tandem.
The positioning on the RRG in combination with the strong (almost 445-degree) RRG-Heading and the recent clearance of overhead resistance in the price chart make EMN one of the most promising stocks in the Materials sector universe.
Julius de Kempenaer | RRG Research
RRG, Relative Rotation Graphs, JdK RS-Ratio, and JdK RS-Momentum are registered TradeMarks by RRG Research
Follow RRG Research on social media:
If you want to discuss RRG with me on SCAN, please use my handle Julius_RRG so I will get a notification


