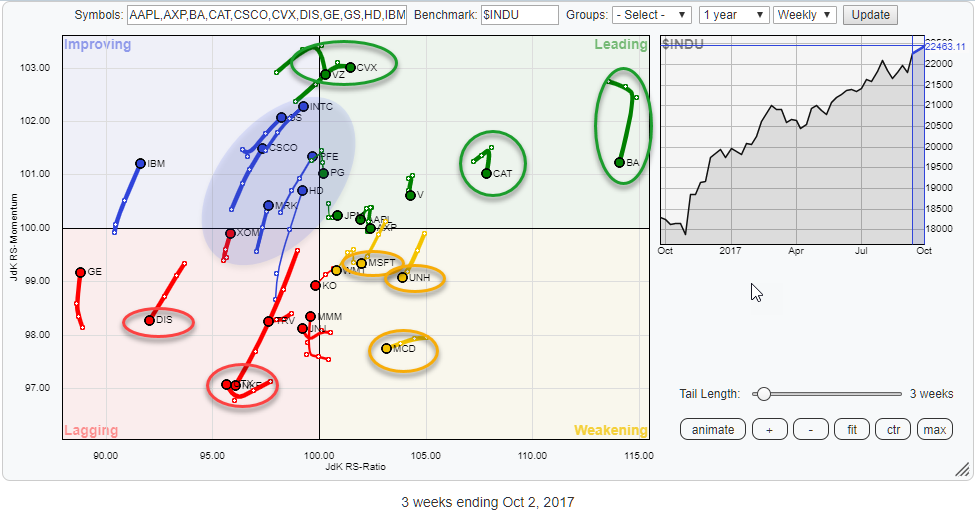
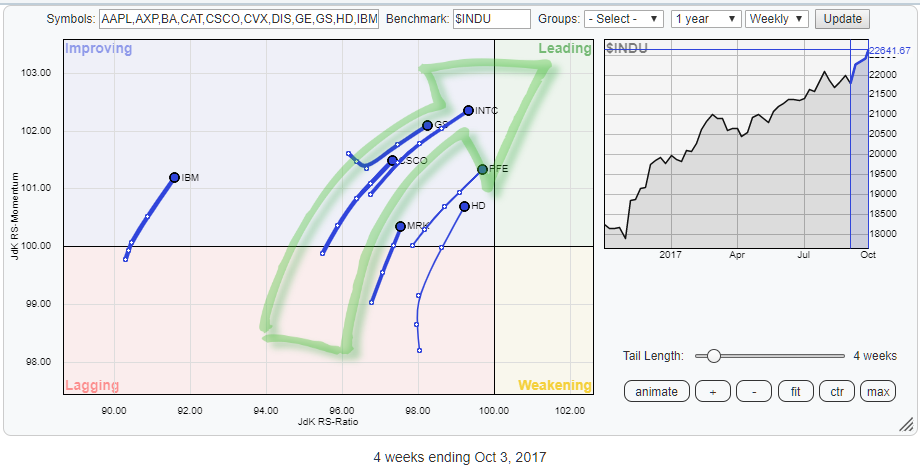
 Plenty of actionable rotation towards the edges of the Relative Rotation Graph above. The RRG holds the 30 members of the Dow Jones Industrials index. Scanning around the outside of the chart the following stocks draw the attention.
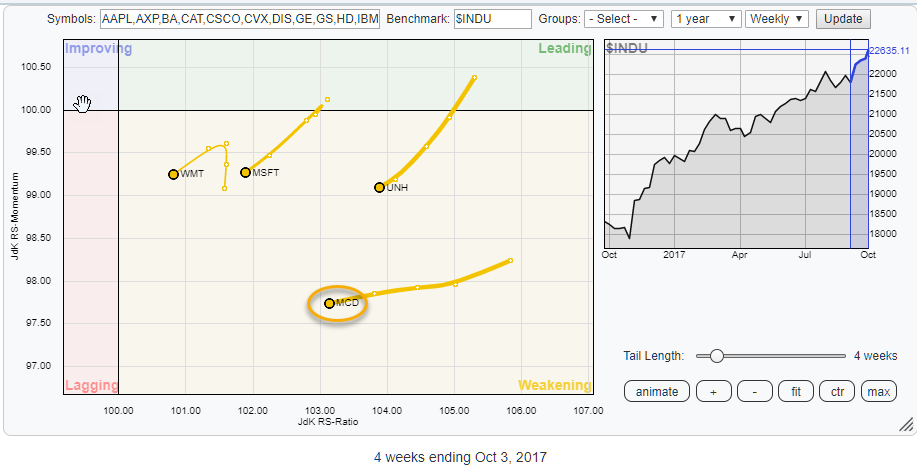
In the weakening quadrant, MCD is at the lowest JdK RS-Momentum reading and heading lower on the JdK RS-Ratio axis, towards the lagging quadrant. Also, MSFT and UNH have just rotated into the weakening quadrant from leading. Already inside the lagging quadrant, the weakest rotations are seen for DIS, NKE, TRV, and UTX.
Close to the benchmark, inside the improving quadrant are a few stocks that have long(er) tails while rotating at a positive RRG-Heading. These can be seen inside the blue shaded oval.
Inside the leading quadrant are BA, CAT, and VZ showing nasty negative hooks down. At the moment only CVX seems to be holding up a positive RRG-Heading, pointing deeper into the leading quadrant.
Summary
- INTC (and PFE) expect to dominate and outperform DJ Industrials in coming weeks
- VZ and PG still offer opportunities despite downturn inside leading quadrant
- MCD expected to underperform while it continues its rotation towards the lagging quadrant through weakening
- Watch out for NKE. Showing very weak rotation back into lagging quadrant powered by a very long tail.
- DIS and TRV also expected to underperform $INDU after breaking horizontal support levels in relative strength and pushing deeper into lagging quadrant.
The LAGGING quadrant
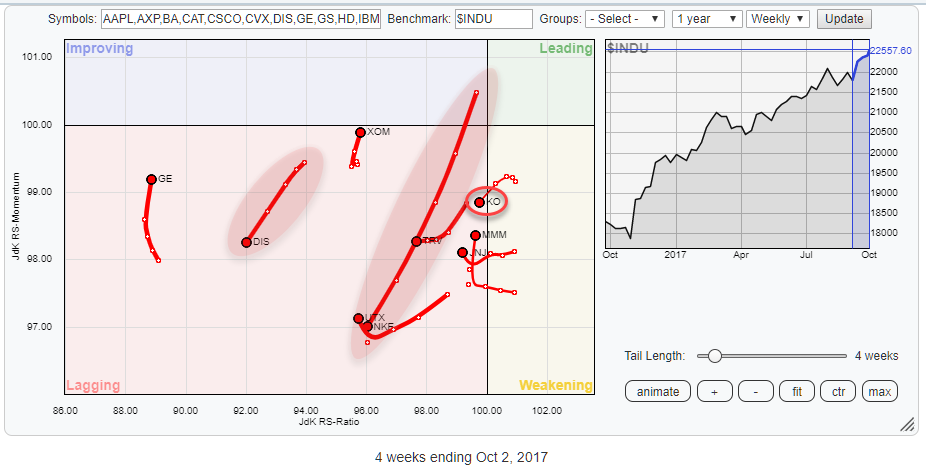
This zoomed in RRG shows the long tails on NKE and, to a lesser extent, DIS. These two are in very weak shape from a rotational point of view.
GE, XOM, and MMM have turned up, at least on the JdK RS-Momentum scale. Inspection of their individual charts learns that GE is still way too far to the left and the current rise in relative momentum will very likely lead to a complete rotation on the left-hand side of the chart.
XOM is improving somewhat but is still lacking the power of strong(er) momentum to push the stock higher on the JdK RS-Momentum scale.
MMM has just crossed over into lagging and immediately started to move higher in RS-Momentum, this could reverse into a strong rotation but it is too early to tell at the moment. The price chart of MMM is still in fairly good shape.
KO has just crossed over into the lagging quadrant and seems to be ready to start a period of underperformance. TRV is a bit further into that process and is expected to continue pushing further into the lagging quadrant.
Nike Inc. - NKE
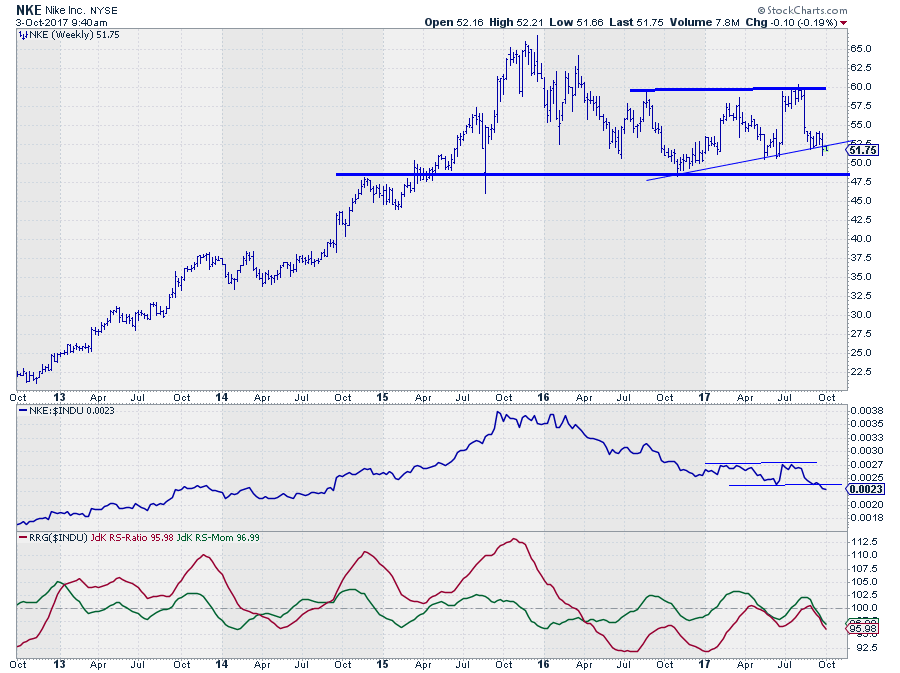
The weakness for NKE is visible on both the price- and the relative charts.
On the price chart, NKE is breaking below the slightly upsloping support line and likely to move lower to the next support level, which is the horizontal barrier just above $ 47.50.
On the raw RS-chart NKE has already broken horizontal support which opens up the way for more relative downside and this will likely cause an acceleration in the decline. Both RRG-Lines are now sharply moving lower, pushing the stock rapidly further into the lagging area, making it a stock to avoid in coming weeks.
Walt Disney Co. - DIS
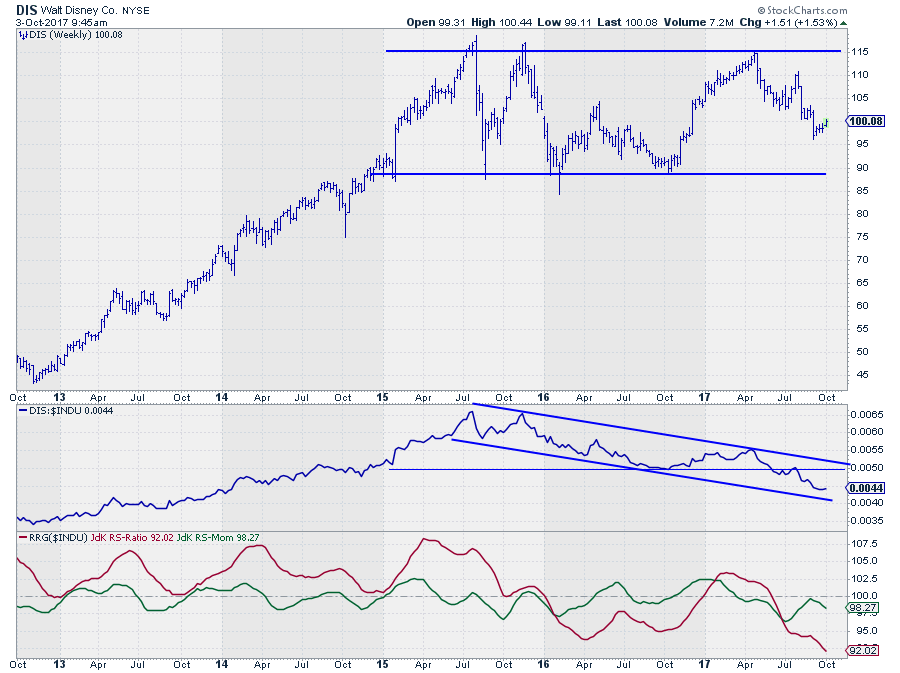
After touching resistance at $ 115 on the price chart, DIS started a series of lower highs and lower lows which is still intact and will very likely bring the stock down to the lower boundary of the broad trading range which is visible since 2015 between $ 90 - $ 115.
The sideways movement since 2015 has led to a downtrend in relative strength compared to the DJ Industrials index. This downtrend got confirmed a few months ago when the RS-line fell through the horizontal support level.
The RRG-Lines moved below 100 in tandem back in June. The small pause around the 2016 low in relative strength caused RS-Momentum to rally back to just below 100 creating a full rotation on the left-hand side of the graph, indicating a strong relative downtrend.
The renewed downward momentum is now pushing the JdK RS-Ratio to its lowest level; of the past 5 years.
Just like NKE, DIS is a stock that is probably better to avoid in coming weeks.
The Travelers Cos, Inc. - TRV
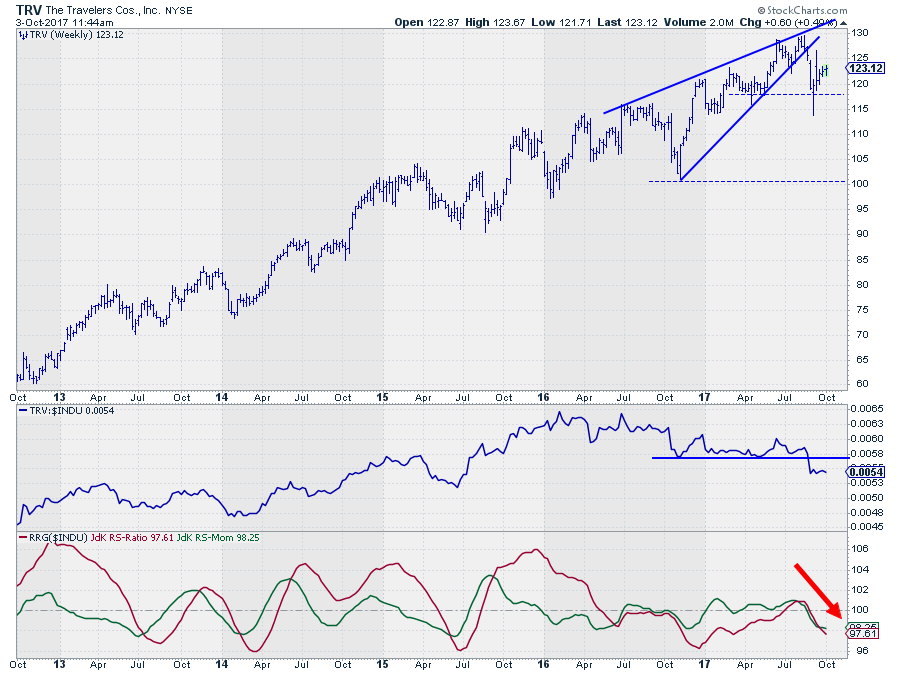
TRV crossed over into the lagging quadrant a few weeks ago. Initially in a RS-Momentum dominated (more or less vertical) move and recently also starting to drop on the JdK RS-Ratio scale. With a RRG-Heading between 180-270 at the moment, it is likely that TRV will loose more relative strength over coming weeks and move further into the lagging quadrant.
The drop below the clear-cut horizontal support level on the RS-chart confirms the weakness.
On the price chart, a big rising wedge has completed. The break below the, steeper, rising support line marked the completion and triggered a sell-sign for TRV. The initial decline was caught at support around $ 117.50. The target for a rising wedge formation is the base of the pattern which in this case means levels around $ 100.
The Weakening quadrant
MSFT and UNH have just crossed over into weakening and both stocks show a JdK RS-Momentum value which is still close to the 100-mark which leaves the opportunity for a short-lived rotation through weakening and then back to leading.
Their price charts in combination with relative strength and RRG-Lines are not decisive yet. Especially the fact that for both stocks the RS-Line is still above a former resistance level and the uptrends in price are still intact makes me give them the benefit of the doubt for now.
MCD is a different story.
McDonalds Corp - MCD
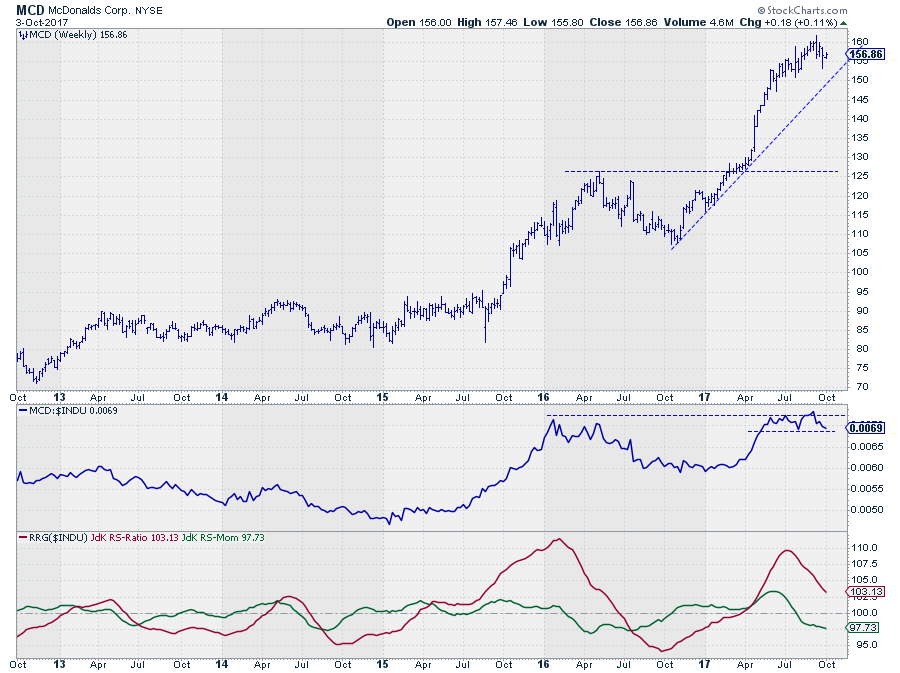
The price trend for MCD is still intact albeit less powerful than a few months ago.
The "problem" for MCD lies in its relative strength against the DJ Industrials index. The RS-Line has run into resistance offered by the early 2016 peaks in relative strength twice and was not able to break that level.
This failure to break higher now puts the RS-Line at risk of forming a double top formation. The double top will be triggered when RS drops below its late July low.
The JdK RS-Momentum line has already moved below 100, putting MCD inside the weakening quadrant. A break of support in the RS-Line will very likely push MCD into the lagging quadrant.
The Leading quadrant
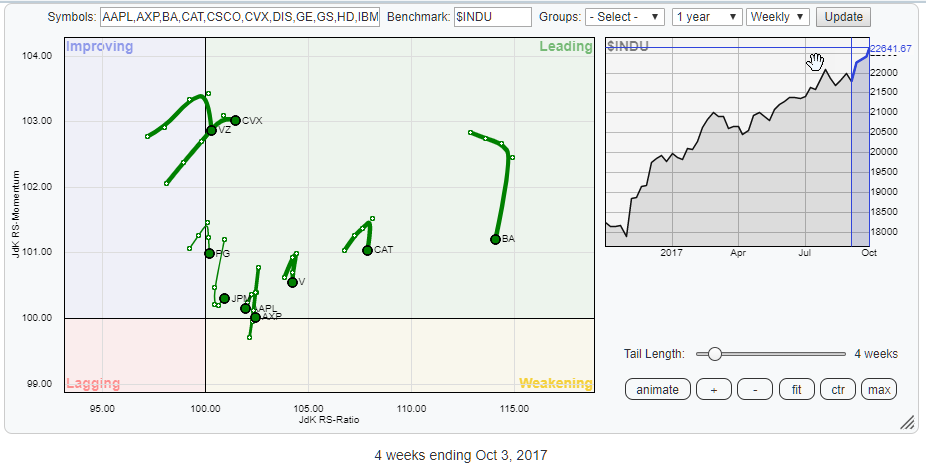
Almost a third of all Dow stocks are inside the leading quadrant but none of those is looking really strong from a rotational point of view.
From right to left the strongest stocks (highest JdK RS-Ratio reading) are BA, CAT, and V. And all of them just turned South.
Especially for BA and CAT, but also for V, these rotations are currently still far to the right AND well within the boundaries of the leading quadrant. This means that the recent weakness in relative strength is more likely to be temporary and that a rotation through weakening and then back into leading is very well possible. No alarm bells here yet.
PG and VZ are also hooking down at the moment but they are doing that right after having entered the leading quadrant.
Verizon Communications - VZ
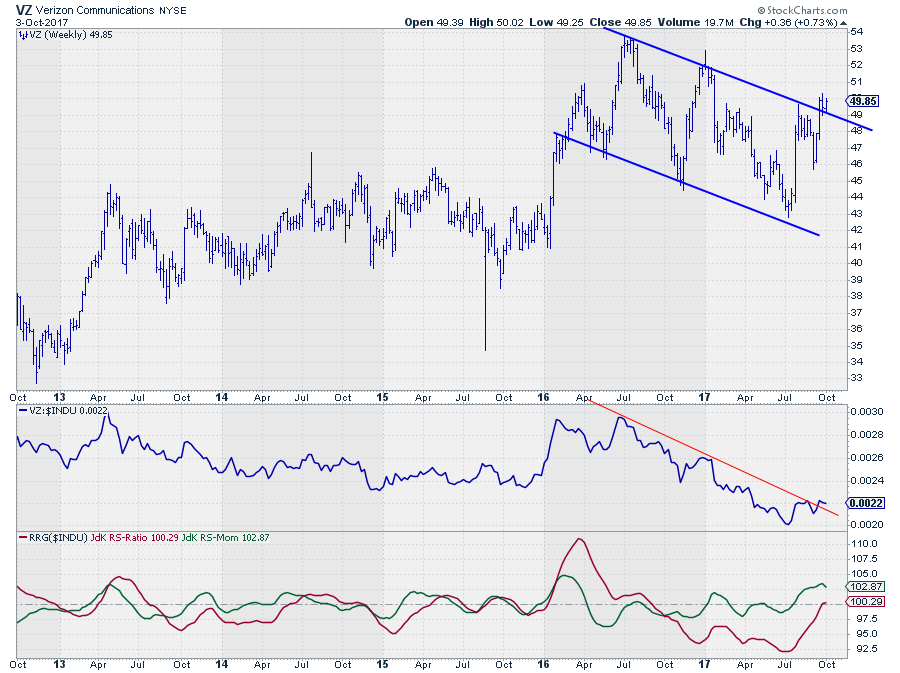
VZ is breaking out of a year-long downtrend on both the relative- and the price charts.
Both breaks are still in their early stages but showing up quite clearly. On the price chart, VZ has already started a new series of higher highs and higher lows as the falling resistance line coincided with the level of the previous high. The downside here should be protected around $ 49.
The relative strength line has not, yet, taken out its previous peak but the break above the falling resistance line is a positive sign. It's the hesitation around the previous RS-high which causes RS-Momentum to stall and pull the rotation down on the RS-Momentum scale very close to the 100 mark for RS-Ratio.
Especially as the week is not over yet the tail on VZ has still time to improve and finish at a better RRG-Heading. I am also keeping an eye on the daily rotational pattern. When VZ pick up a positive RRG-Heading there I expect things to continue to improve on the weekly time-frame as well.
Proctor & Gamble Co. - PG
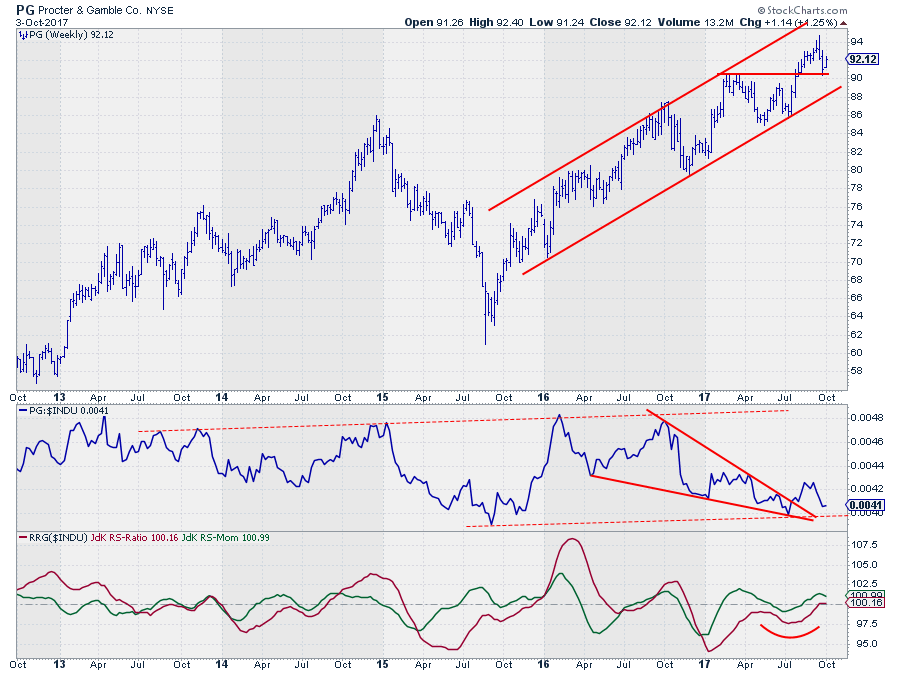
PG is showing a similar rotation as VZ, but at a lower level on the RS-Momentum scale. On the one hand this makes it a bit riskier or less reliable but on the other hand, it offers more opportunities as there is more potential to the upside.
The trend on the price chart is still looking very good for PG. After breaking resistance near $ 90, that level is now being tested as support and holding up well, keeping the rhythm of higher highs and higher lows intact.
On the RS-chart PG has tested its lower boundary in July and moved higher off of that support level. The pattern that led PG to the lower boundary of the broad range has taken the shape of a falling wedge which is a bullish formation.
At the moment RS is correcting from its first high after the initial break which causes RS-Momentum to stall. When RS can hold up above its previous low and start moving higher again this will be a very interesting chart to monitor as the target based on the falling wedge formation is the top of the pattern i.e. the RS-peak levels of 2016.
The improving quadrant
Opposite to the RRG-Headings seen in the leading quadrant, the tails on the stocks that are positioned inside the improving quadrant look a lot stronger. ALL of them are currently at a strong positive RRG-Heading (between 0-90 degrees).
The best opportunities are probably found in INTC and PFE.
Intel Corp. - INTC
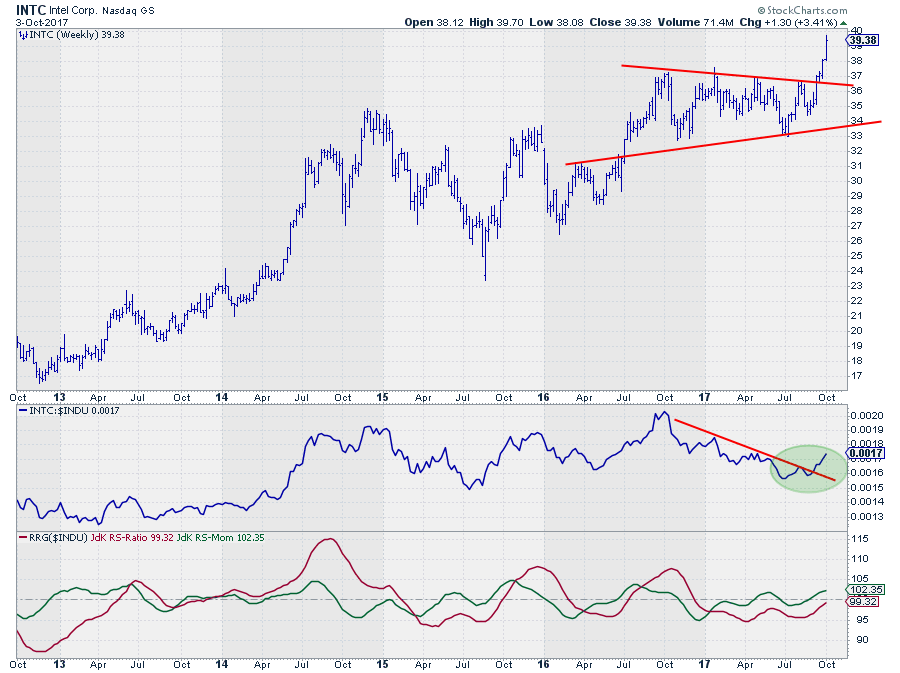
The chart of INTC is showing one of the strongest breaks in individual Dow stocks at the moment. Three weeks ago INTC challenged the upper boundary of the triangle-like formation. After settling in and remaining above that old resistance level INTC started to take off and is now comfortable trading above its 2016 highs which means that the next resistance level is only found at the level of the all-time-high that was set back in 2000 near $ 50.
The RS-Ratio line followed the RS-Momentum line below 100 at the end of 2016 and pushed INTC into the lagging quadrant. Very recently the RS-Momentum line ha crossed back above the 100-mark while the raw RS-Line broke above its falling resistance line.
The combination of a breakout in price, as well as relative strength, is a strong sign and suggests that more upside may be expected. INTC will very likely be one of the drivers of the DJ Industrials index in coming weeks.
Pfizer Inc. - PFE
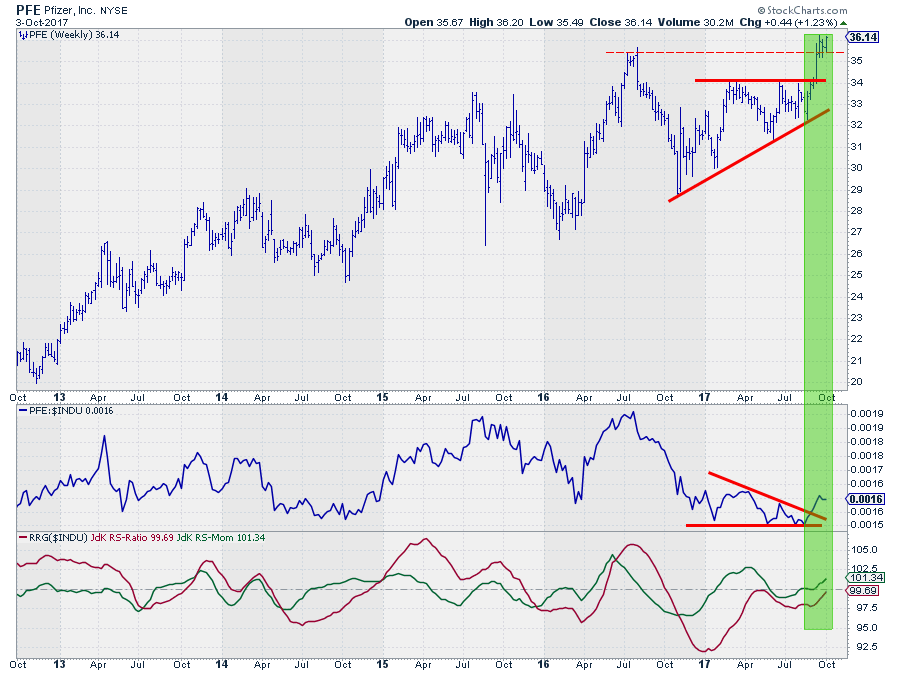
On the Relative Rotation Graph, PFE is positioned similar to INTC, inside the improving quadrant, close to the 100-level on the RS-Ratio axis and powered by a long tail indicating that there is power behind the rotation.
On the price chart PFE just broke to new highs by taking out its 2016 peak level. Just after completing an ascending triangle formation which traced out since late last year.
With the RS-Line tracing out a bottom formation and both RRG-Lines heading higher, PFE is close to entering the leading quadrant at a positive RRG-Heading and ready for a period of outperforming the DJ Industrials index.
If you like to receive a notification anytime, a new article is posted in this RRG blog, please leave your email address and press the green "Notify Me!" button below this article.
Julius de Kempenaer | RRG Research
RRG, Relative Rotation Graphs, JdK RS-Ratio, and JdK RS-Momentum are registered TradeMarks by RRG Research
Follow RRG Research on social media:
If you want to discuss RRG with me on SCAN, please use my handle Julius_RRG so that I will get a notification


