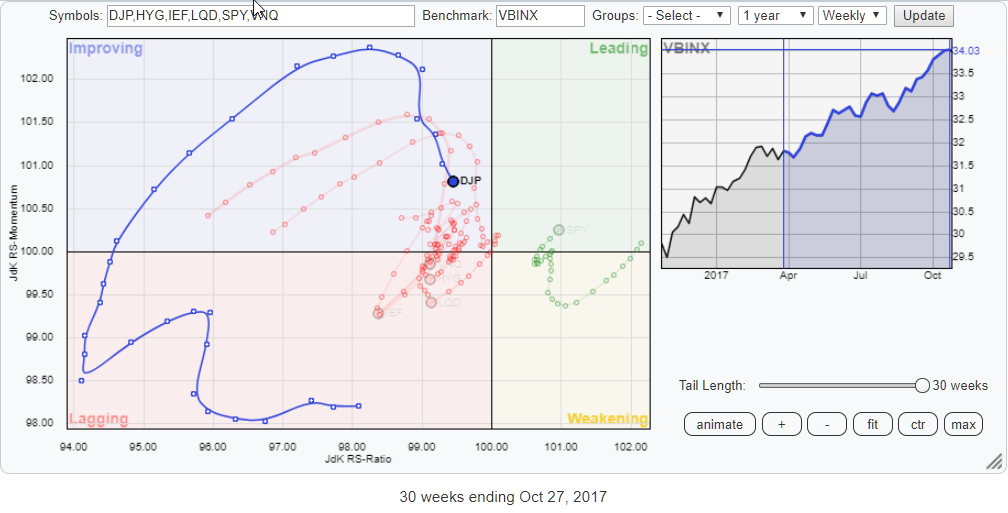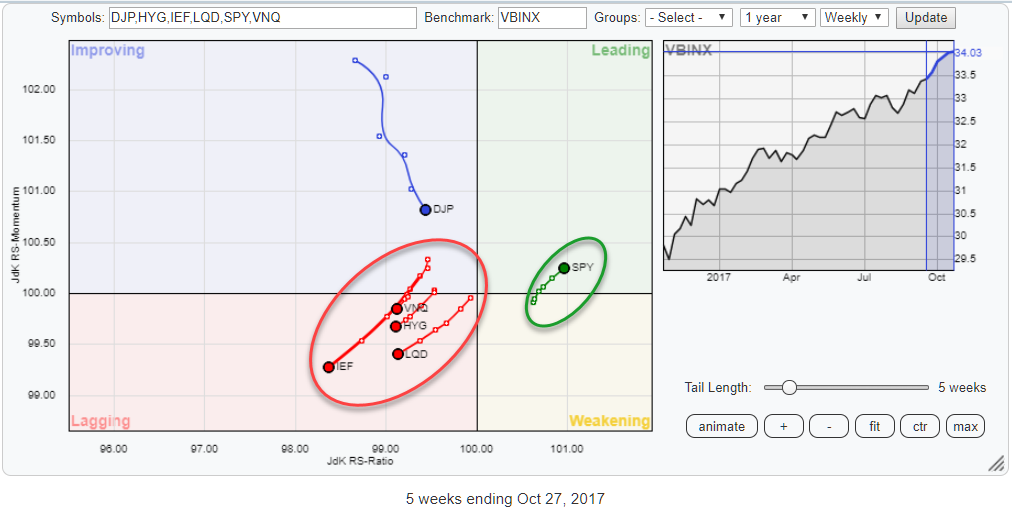
The Relative Rotation Graph above holds six ETF that represent various asset classes.
The picture gives you the big picture of what is going on at asset class level on a relative basis against VBINX which is a Vanguard balanced index fund (60% equity / 40% bonds).
This one frame immediately makes crystal clear that, from a relative point of view, there is only one asset class that is outperforming the benchmark and that is equities (SPY).
Summary
- Watch DJP for a break above $ 25
- Real-Estate (VNQ) breaking out of rising wedge, facing target around $ 75
- Equities (SPY) and Gov Bonds (IEF) at opposite RRG-heading signaling clear preference for equities over bonds
Improving and weakening quadrants thinly populated
The top-left (improving) and bottom-right (weakening) quadrants are thinly populated at the moment. With SPY rotating from weakening back into leading a few weeks ago there is now no asset class found inside the weakening quadrant.
Inside the improving quadrant, we only find commodities and they seemed to be in the process of completing a rotation completely on the left-hand (weak) side of the RRG but just now started to pick up relative strength (higher JdK RS-Ratio) again.
The (big) question for this asset class is if the recent loss of relative momentum (declining JdK RS-Momentum values) can be turned around "now" and DJP can continue its rotational pattern into the leading quadrant. Or if another rotation on the left-hand side of the RRG is needed before the leading quadrant can be reached.
Commodities (DJP)
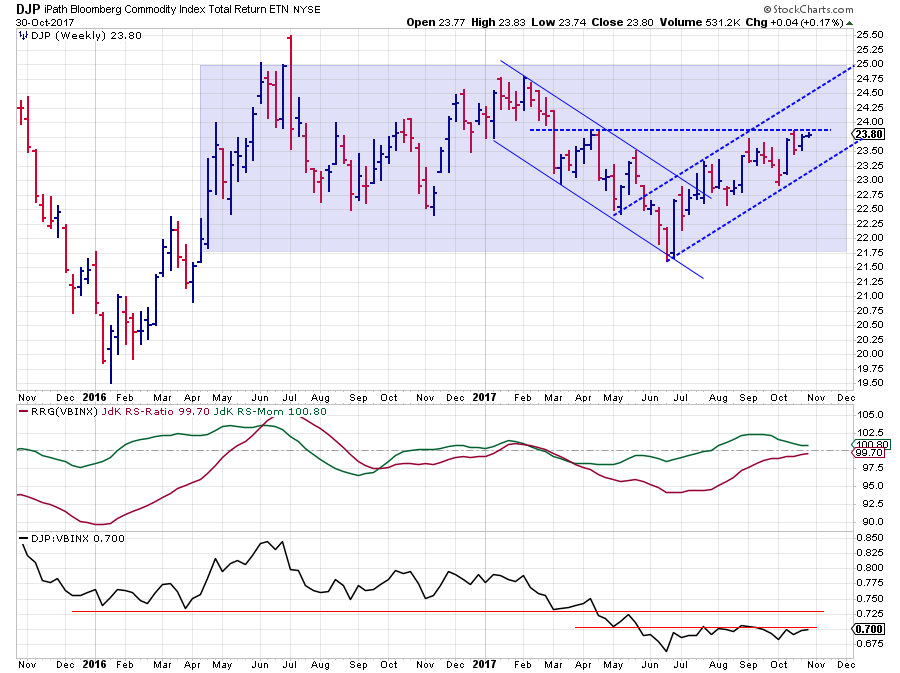
The chart of DJP in combination with the RRG-Lines and its relative strength against VBINX over the last two years shows a declining RS since mid-2016 which started stabilizing in June of this year. This sideways move caused DJP to rotate from lagging into improving when JdK RS-momentum crossed above the 100-line.
As you can see that boost of relative momentum started to roll over since September and is now slowly approaching 100. While JdK RS-Ratio is doing the same from the other side of 100 causing an indecisive picture very close to the benchmark on the RRG (100,100).
From a relative perspective, the RS-Line is facing two serious overhead resistance levels (horizontal red lines in the RS-chart) that need to be taken out before a rotation into leading can be achieved.
The catalyst for such an improvement surely needs to come from price action. The rally out of the mid-2017 low is now running into resistance just below $ 24. This horizontal barrier is the level that I am watching for a break at the moment.
If that happens in coming weeks, the path to $25 will be cleared for DJP but more importantly a further improvement of relative strength against VBINX is very likely in that case which will push DJP into the leading quadrant and make it one of the stronger asset classes.
Zooming in
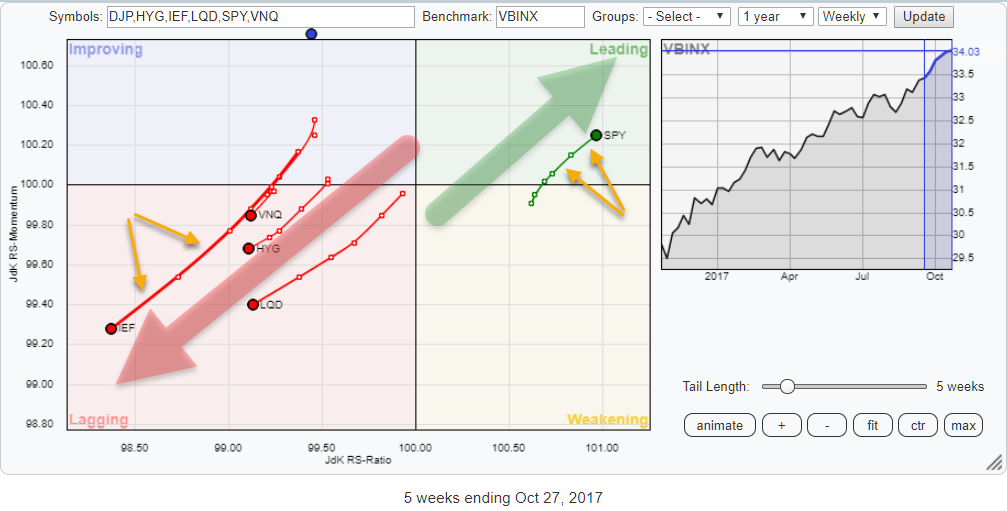
With the rotational pattern of DJP out of the way, we can zoom in on the remaining asset classes on this Relative Rotation Graph.
And the picture here is pretty clear: Real-Estate and all fixed income related asset classes are heading South-West (negative) and only one asset class, equities, is heading in a North-Eastern direction. And what is more, on both sides the moves seems to be accelerating. This can be detected by watching the distances from week to week on the tails getting further apart.
Real-Estate (VNQ)
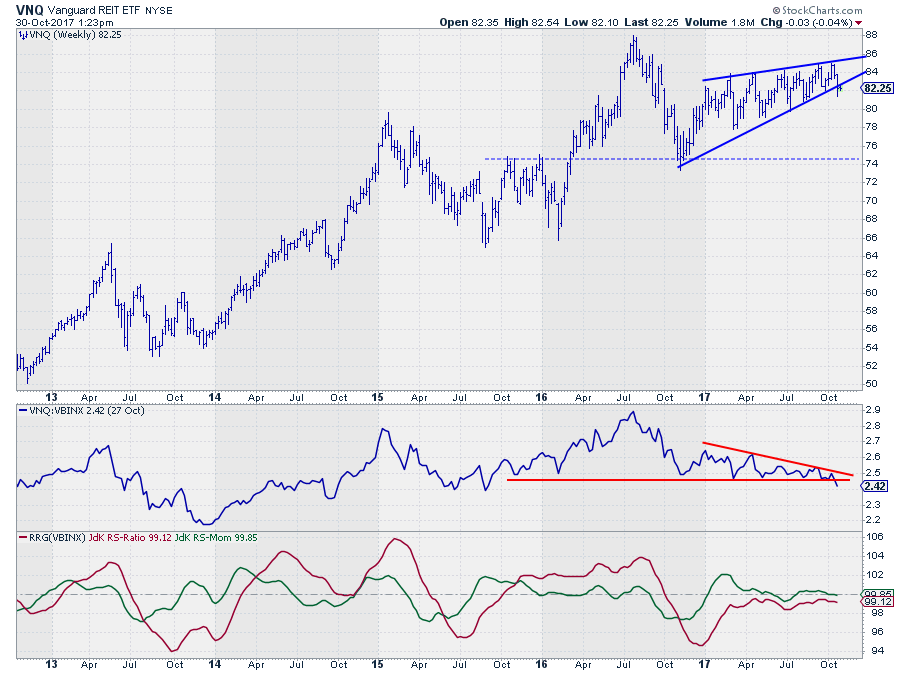
Looking at the price chart of VNQ, we see that pretty much since the beginning of this year, the trend has been sideways to slightly up. In any case, nowhere near the performance of the S&P 500.
The formation that is tracing out since late 2016 can be seen as a rising wedge which is about to be broken to the downside. The downward break out of a rising wedge formation usually has negative implications, and the price target can be pegged at the bottom of the formation, which in this case would mean the area around $ 74-76.
Compared to VBINX, the performance has been sideways, touching a horizontal support level a few times over the course of the past months. Until now!
With the downward break of that horizontal support level in relative strength, a follow through is expected to push the relative position for VNQ on the RRG further into the lagging quadrant. A continuation of the underperformance against VBINX is expected.
Government Bonds - IEF
Out of the three fixed-income related asset classes, Government Bonds (IEF) is leading the pack deeper into the lagging quadrant on the RRG. The other two, High Yield (HYG) and Corporate Bonds (LQD) are following suit.
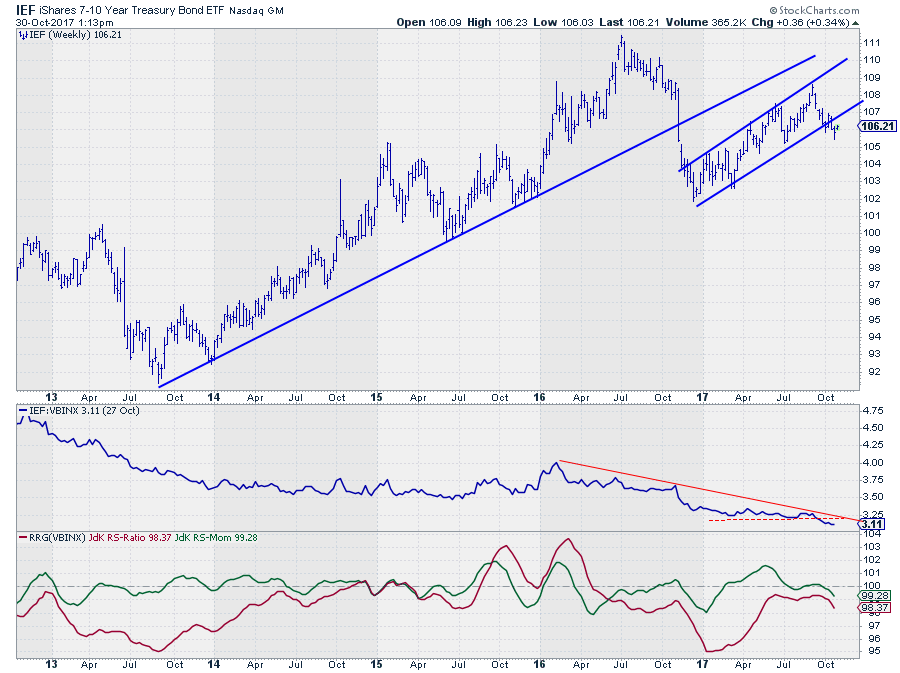
After the sharp drop towards the end of 2016, IEF is showing a recovery rally emerging out of the late 2017 low near $ 102. This series of higher highs and higher lows now seems to break below the lower boundary of its channel, suggesting that a renewed period of falling price can be expected.
The RS-Line moved flat during 2017 so far but is still well below the falling resistance line that connects the peaks since early 2016. The recent break below horizontal support triggered a new wave of relative weakness pushing both RRG-Lines below 100.
The acceleration of this move shows up on the tail of IEF on the Relative Rotation Graph by widening distances between the last few weekly observations.
Long-term perspective
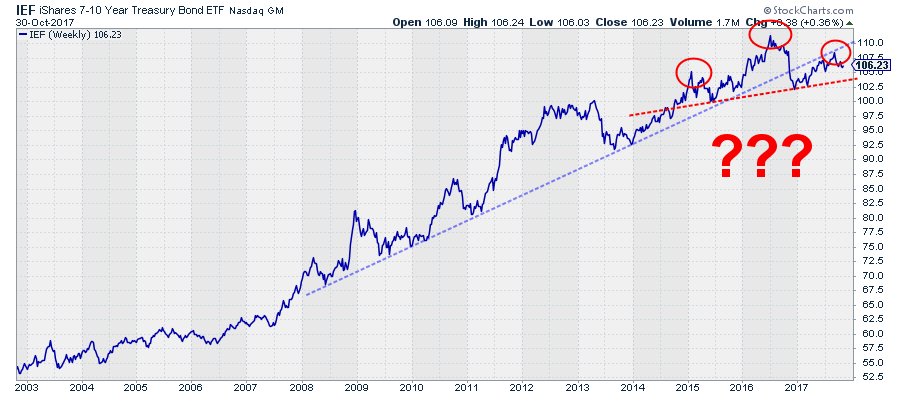
Taking a step back and looking at the longer-term price chart of IEF I noticed that the trendline, running under the lows since 2008, was broken late last year. But also that the recovery rally after that break rolled over, while testing that old support line as resistance, potentially setting the right shoulder of a large H&S top.
It is still very early and a lot of things can happen but I am certainly going to keep an eye on levels around $ 104.
Equities - SPY
At the opposite side of the asset classes clustered in the lagging quadrant, we find SPY (Equities) inside the leading quadrant, to which they just returned after a rotation through weakening.
Looking at the zoomed in RRG you can see that just like on the tail of IEF, the distances between the week to week observations on the tail of SPY are increasing. This is an indication of (increasing) power behind the move.
The fact that the direction, the RRG-Heading, for SPY and IEF is more or less exactly opposite gives a very clear indication that Equities is the asset class to prefer at the moment.
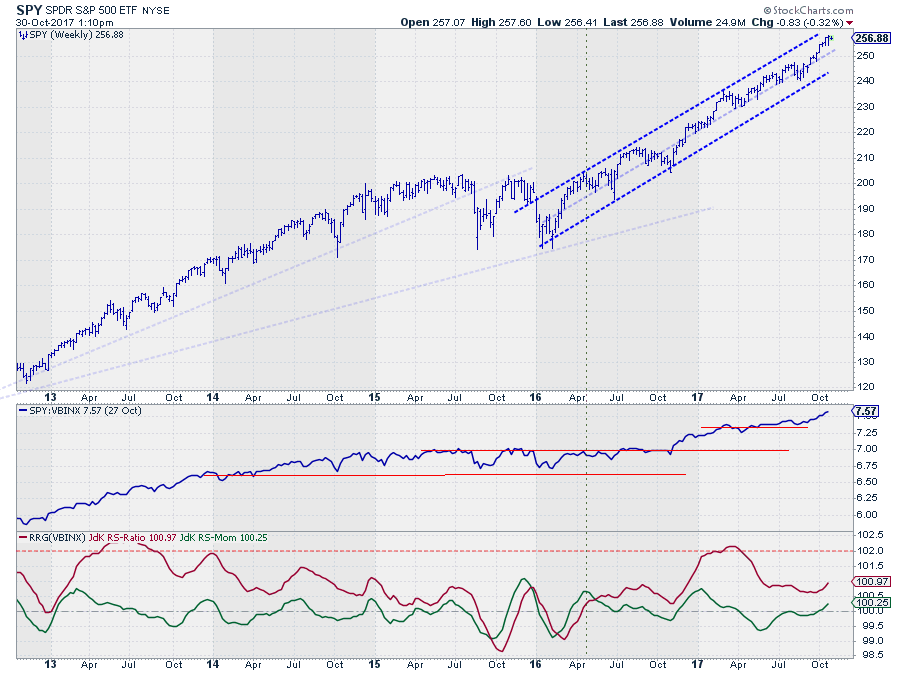
The recent rotation through weakening (RS-Momentum below 100 while RS-Ratio above) caused the RS-Ratio line to come down in value while remaining comfortably above 100 which means that there is now again enough upside potential in relative terms to continue this period of outperformance.
Looking at the price chart shows that the trend channel is still fully intact and that SPY is touching the upper boundary. This also means that there is plenty of room WITHIN the boundaries of the channel for SPY to move WITHOUT breaking that trend.
As a matter of fact, SPY can drop to levels around 245 where the level of the former peak and the rising support line are coincident, without harming the current up-trend.
With both RRG-Lines well above 100 and rising, positioned inside the leading quadrant at a strong RRG-Heading, and a strong uptrend on the price chart, SPY (equities) are still the asset class that needs to be overweight to beat balanced portfolios (VBINX).
If you like to receive a notification anytime, a new article is posted in this RRG blog, please leave your email address and press the green "Notify Me!" button below this article.
Julius de Kempenaer | RRG Research
RRG, Relative Rotation Graphs, JdK RS-Ratio, and JdK RS-Momentum are registered TradeMarks by RRG Research
Follow RRG Research on social media:
If you want to discuss RRG with me on SCAN, please use my handle Julius_RRG so that I will get a notification

