
Last week Wednesday (29 November) I was the guest of Tom and Erin in the Market Watchers Live show.
During the show, we talked a lot about RRG, Relative Rotation Graphs, covering some basics and some new(er) techniques and interpretations that I have been working on.
If you missed the show you can watch the recording on the MWL youtube channel here.
As you may know, people can post comments or pose questions in the sidebar during the show. I have tried to answer questions and respond to comments during the show, but I was not able to catch all of them at that time.
So I copy-pasted a number of questions and remarks from the show to get back to at a later stage. That stage is now in this article.
For clarity, I have broken down the article into two sections. One that deals with the "comments" that are not really questions and one section that answers the "questions."
Comments
1. Use RRG on StockCharts.com every day, many times. It is always my starting point in looking for new leadership.
2. This (see 1.) is exactly how I use RRG when looking at new opportunities in different markets
When I present RRG to people who have never seen it before or are only vaguely aware of them I explain that RRG is not intending to be a replacement for the workflow they usually follow in their investment process.
Over the course of the years, I have had many (sales) people at my various desks who were all pitching the next best strategy/indicator/trading -system/-software, etc. to me. Out of courtesy, I would listen to them, but at the end of the day, we all know what would happen with the brochures the papers and the test-CDs..... After a few years, you'd find them back at the bottom of your desk drawer full of dust and then you'd bin it.
So my intention has never been and will never be to push RRG as a "replacement" for anything you are currently doing. I also so do not believe that there is only one single way of doing things. There are many ways to analyze financial markets, many disciplines, many methods. And one is not "better" than another. They are different, and they appeal to different people.
Since RRG came to life, I always told people to use it as an idea generator. As a Relative Rotation Graph gives you the "BIG picture in ONE picture" it is a great tool, yes I am biased, to help you get started to see what's going on in the market as a whole and then drill down through sectors and individual equities and make selections.
With regard to points 1. and 2. I fully agree with those comments but from there on I strongly advise everybody to apply any and all analysis techniques as you have always been doing. Hopefully using Relative Rotation Graphs you will be able to narrow down your search for interesting stocks easier and faster with the complete picture in mind.
3. Start with weekly and then go to daily to see id daily confirms the weekly
This touches upon one of the most frequently asked questions about RRG and that is "What is the difference between weekly and daily RRGs?". There is a ChartSchool article about this subject here where you can read about this in more depth.
Also in the MWL video, I talk about this subject at 29:00 especially check out the small video clip where I show a weekly and a daily animated rotation on top of each other.
Using the combination of weekly and daily time-frames in RRG to confirm each other as described under 3. is definitely a good approach.
4. An hourly time-frame for RRG will be very useful for traders
I certainly agree with this assessment. Intraday time frames will be very beneficial for shorter-term traders as it enables them to keep an eye on general market developments during the day without having to browse through heaps of charts.
I actually know of some FOREX traders who are keeping a 5-minute RRG in the top of their screen to spot anomalies and "strange" behavior in their markets which they then want to investigate further.
You may have noticed that the StockCharts.com site is undergoing a big overhaul at the moment new features are being added, and existing tools are getting updated and modernized. This is taking up a lot of resources, so I do not expect an addition of intraday time-frames for RRG anytime soon, but I will certainly push it (again) when things are getting a bit quieter on the dev front (if ever).
5. It would help all chart watchers to have a predefined RRG for asset class and sector allocation. It's a great general guidance.
In the groups drop-down box at the top of the RRG, there is already a predefined group for sectors.
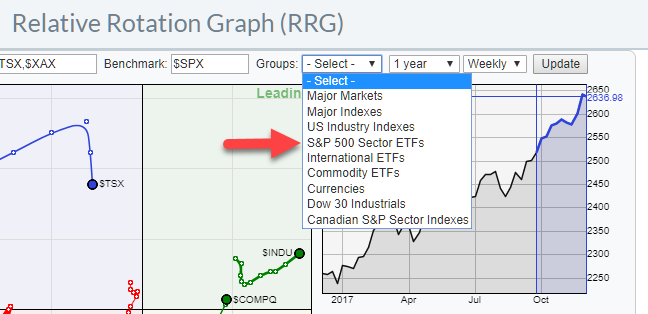
I am planning to make a few changes to these groups and add some more. When that happens, I will certainly add the predefined asset allocation group that I always use in my blogs on Asset Class rotation.
6. It would be great if Julius could add a predefined RRG ChartStyle.
Yes, that is another one on the to-do list, a chart-style and maybe a chart-pack drilling down through various universes. (any thoughts on that?)
7. Cool, I did not know that highlight feature!
This comment refers to the possibility to "toggle" through the various securities on an RRG by highlighting one and dimming the others.
This can be done by selecting a line in the table below the RRG. This will highlight the selected symbol on the RRG. After that, you can use the Ctrl key in combination with arrow up-down to toggle through all other symbols on the chart.
It gives me the opportunity to easier inspect the rotation of that particular symbol while still being able to see the relationship with all others on the plot. The highlight will be maintained when you start scrolling through history.
Questions
1. Can we split screen like this?
This question refers to a moment in the show, around 1:19. where I positioned two browser windows next to each other on my screen as shown in the screenshot below.
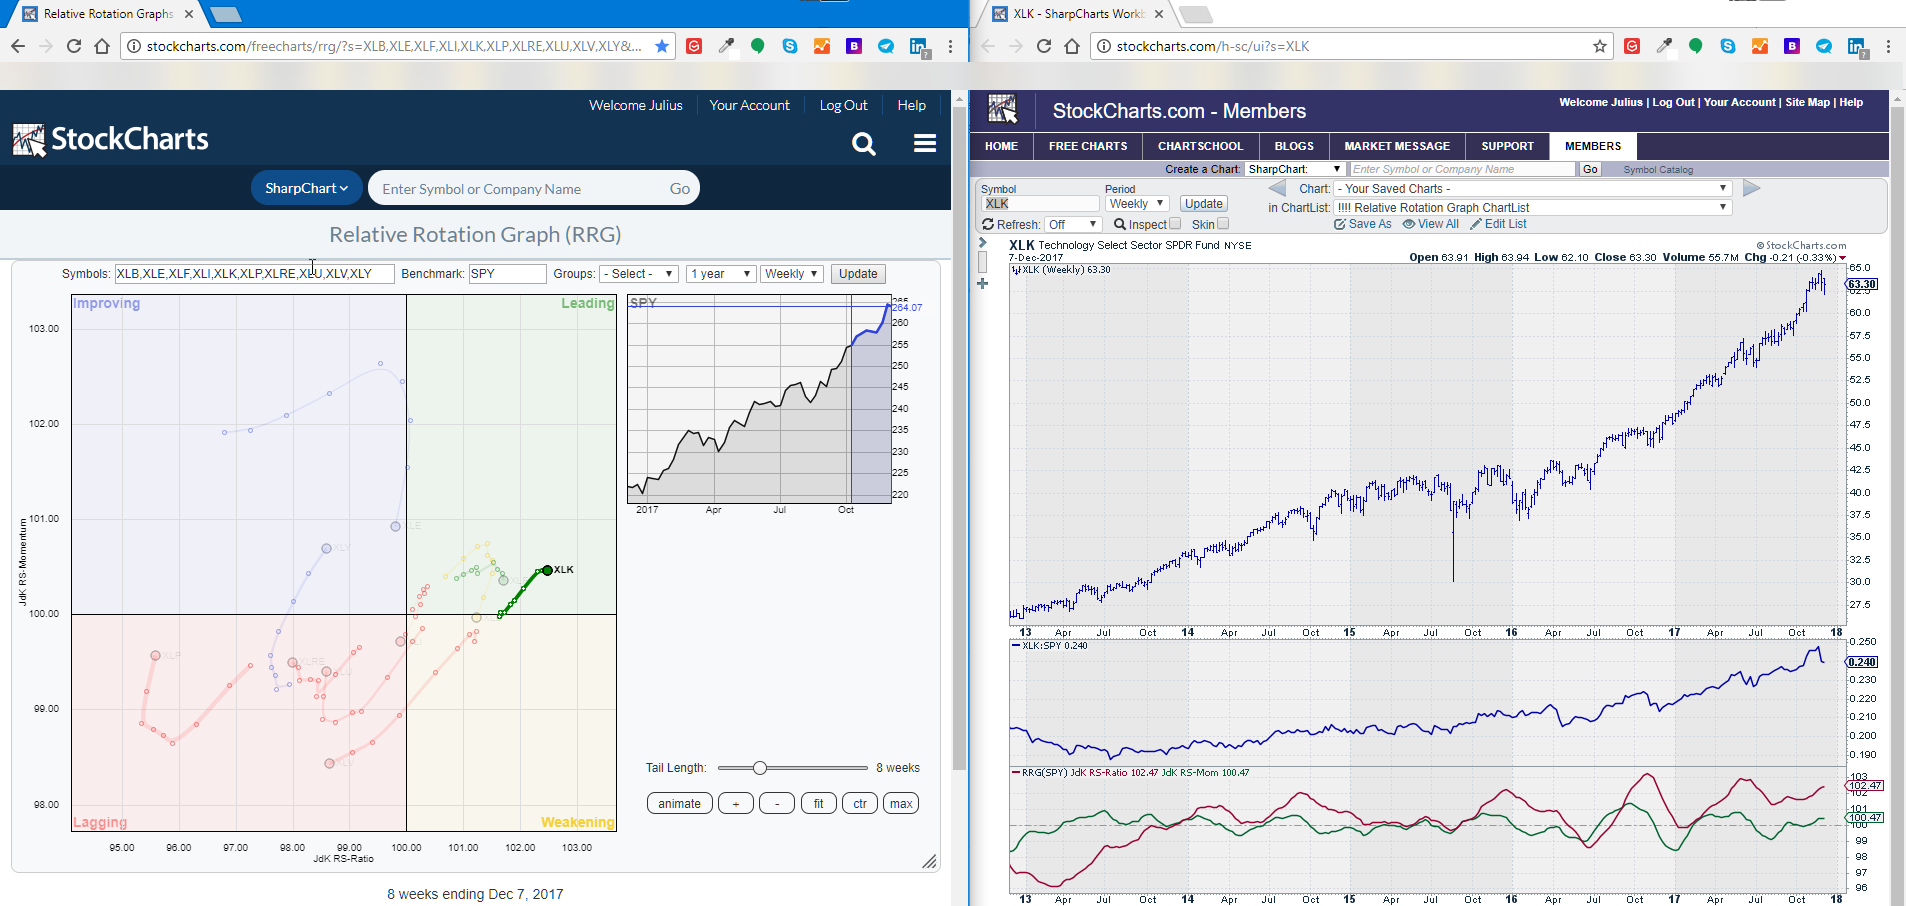
This is not a StockCharts feature but something that Windows (10) lets you do pretty easily. Just grab the top bar of a browser window and drag it to the right edge and release it. Windows will automagically fill the right half of your screen with that window. Then do the same with the second browser window at the left and you will have two separate browser windows where you can pull up an RRG in one and a regular chart in the other.
I use this type of screen setting all the time to relate the rotational pattern that I see on the RRG back to regular charts.
2. Can RRG charts be saved in a list?
Unfortunately, they cannot be saved in a list similar to sharp-charts.
However, what we can do, is creating a Permalink to the RRG and save and organize them as bookmarks. Just like you save and organize other bookmarks in your browser.
The permalink is created by clicking the button below the table underneath the RRG. See the chart below! Copy that link, open it in a new tab and then bookmark that page.
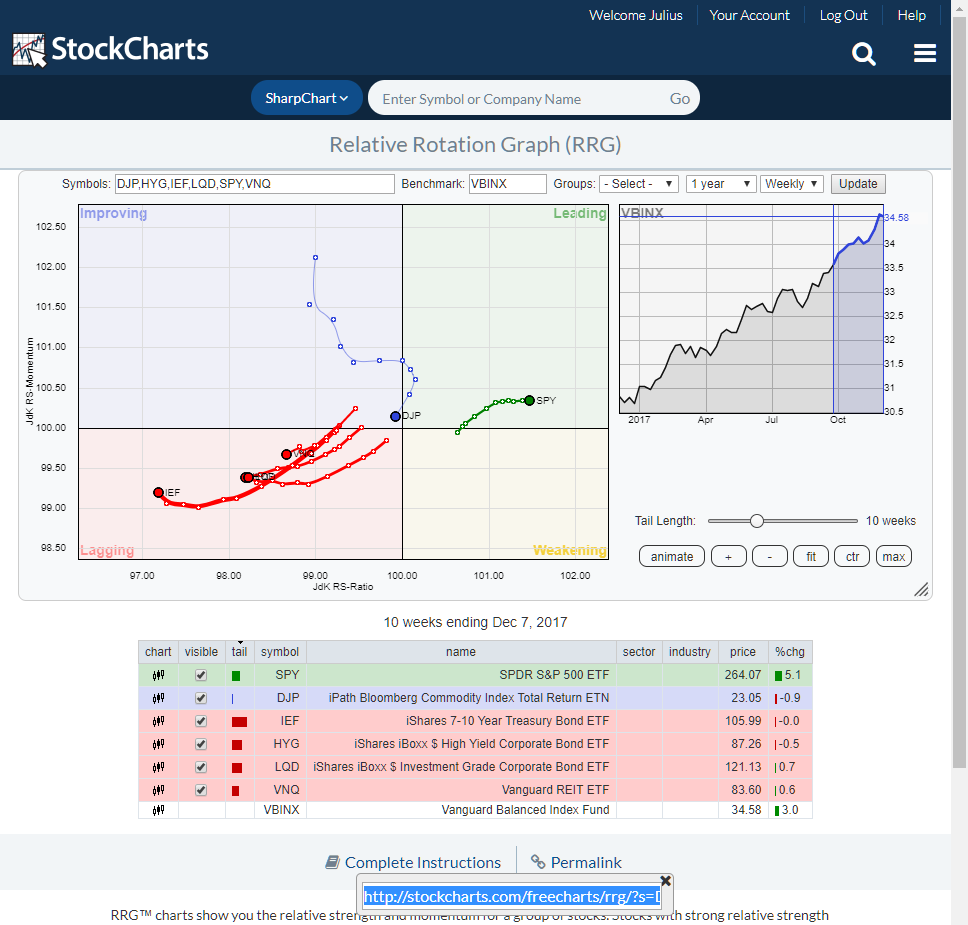
3. Please post the RRG for asset classes in the MW recap.
That was done but here it is again, including a link to the live version that you can save as a bookmark on your own machine. Next time you'd like to look at asset classes it's literally only one click away.
4. Is the RRG-Heading tool available in StockCharts?
5. Can RRG-Heading be used in scan-criteria?
6. Can RRG be incorporated into scans?
At the moment RRG-Heading is not (yet) available in Stockcharts.com, but it is easy to eyeball once you know what you are looking for. Check the MWL replay around 38:00 where I explain the RRG-Heading concept. As a result, RRG-Heading is also not available in scan criteria, nor are the RRG values (JdK RS-Ratio and JdK RS-Momentum).
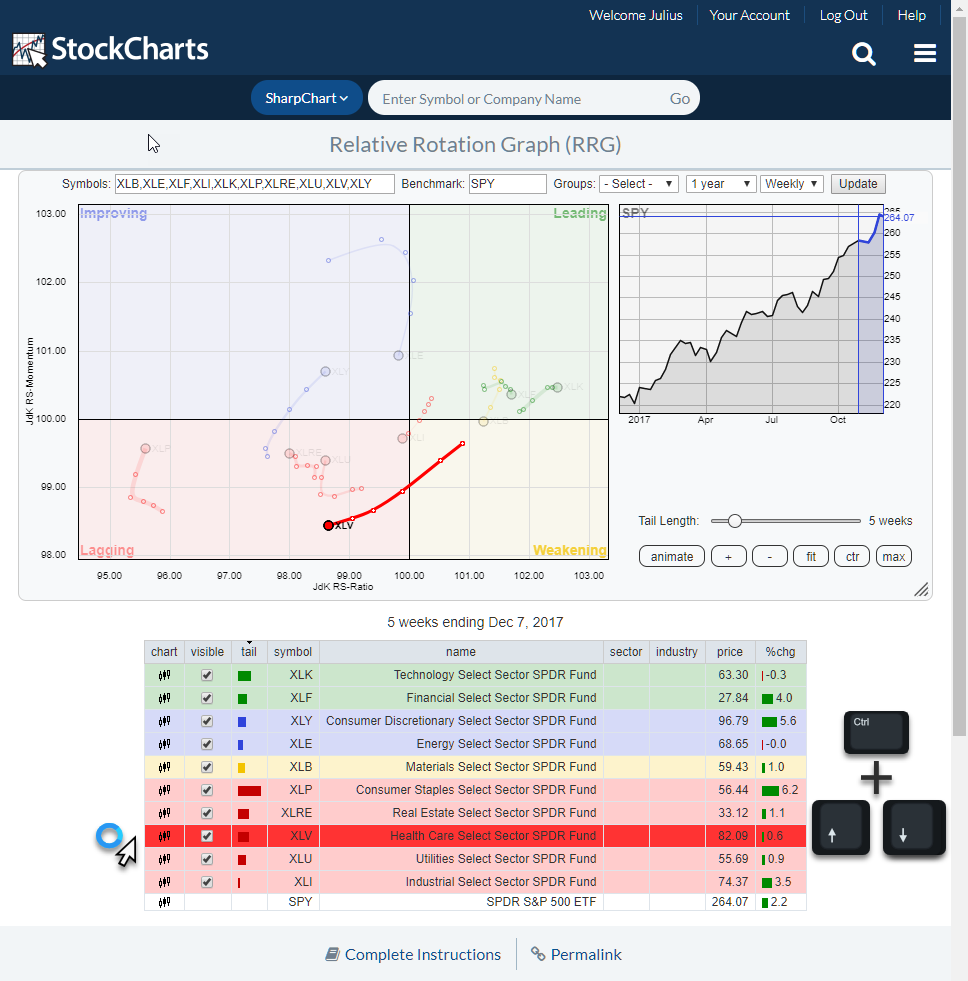
7. Do you typically use a 5-week RRG?
This question most likely refers to the length of the tail. Now be careful, sliding that tail length up or down changes nothing on the positioning nor the rotation of the securities on the Relative Rotation Graph. It is only a cosmetic tool to make the chart more readable if needed.
Typically you can set the tail length to longer values when you have only a few stocks/sectors on the plot. When you have a lot of securities, long tails start to look like spaghetti and will make the chart unreadable. So the tail length is mostly a balancing act between the number of securities on the plot and readability.
If you are looking to inspect longer historical tails on a crowded RRG chart, it's a good idea to set a long tail-length and then use the highlight functionality and the Ctrl-arrow keys to browse through all securities. I find that this gives me a very good insight into the rotational patterns that are playing out at the moment.
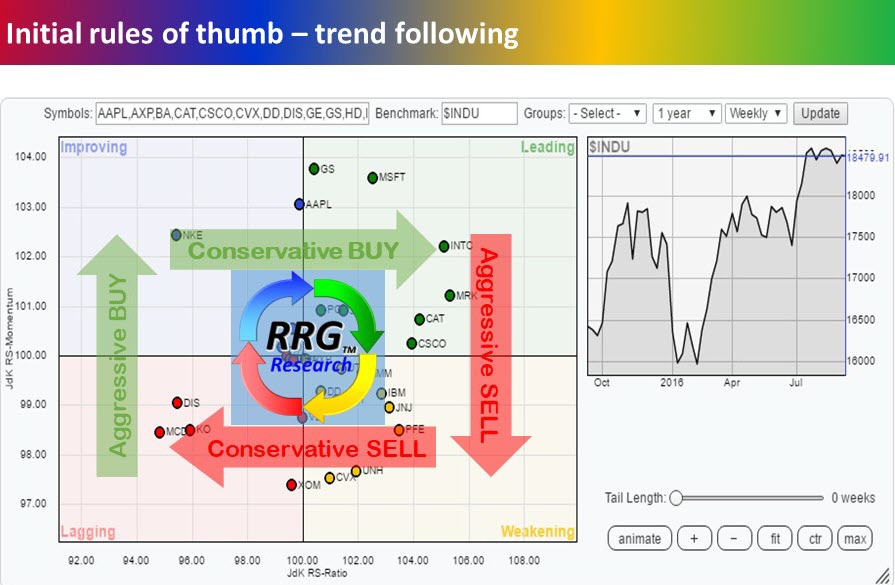
8. Can you show the chart from Chartcon 2016 showing "Aggressive Buy - Aggressive sell vs. Conservative Buy/Sell"?
Sure I can. Here it is!
There were a few more questions which I am saving for a separate blog-post as they require a bit more extensive explanation, and also it prevents this post to fall into the TL;DR category .... :) By the way, about post-length I'd love to hear your thoughts. Are they in general long enough as they are, would you prefer shorter or longer? More images and less text or the other way around? Etc. All input is valuable and will help me to produce what you actually like to read and watch!
If you like to receive a notification anytime, a new article is posted on this RRG blog, please leave your email address and press the green "Notify Me!" button below this article.
Julius de Kempenaer | RRG Research
RRG, Relative Rotation Graphs, JdK RS-Ratio, and JdK RS-Momentum are registered TradeMarks of RRG Research
Follow RRG Research on social media:
If you want to discuss RRG with me on SCAN, please use my handle Julius_RRG so that I will get a notification


