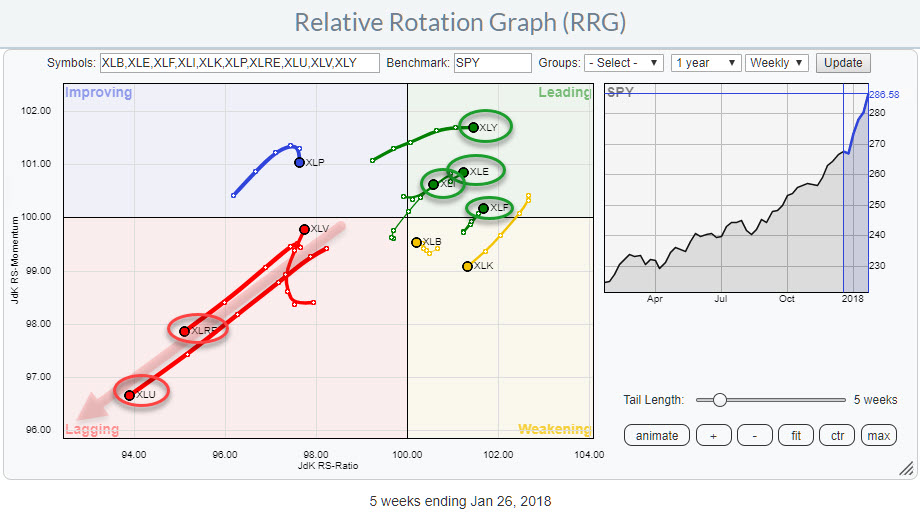
 The Relative Rotation Graph shows the positions of US sectors against SPY as of 26 Jan. Sometimes the rotational patterns are not so clear but in this example, there is one observation sending a screaming message:
Avoid Real-Estate and Utilities.
At the other end of the spectrum inside the leading quadrant, we find a few sectors that show a more positive relative picture.
XLY (Consumer Discretionary) shows up at the highest JdK RS-Momentum reading but at the same time has turned at an RRG heading of almost exactly 90 degrees where we prefer heading between 0-90 degrees with 45 degrees being ideal (similar rise on both axes).
At better RRG-Headings and pushing further into the leading quadrant are XLI, XLE and XLF.
XLF just rotated back into leading after a very short stint through weakening, which is a strong sign indicating that Financials is still one of the strongest sectors, if not THE strongest sector in the S&P 500 universe.
Industrials (XLI) also turned back up after a downward rotation but needed a brief period inside the lagging quadrant before being able to shoot back into leading. The increasing length of the tail over the past three weeks suggests that there is power behind this move.
And there is the energy sector (XLE) which definitely moved into the leading quadrant over the last five weeks after a few indecisive weeks.
Summary
- Very clear message to stay away from XLRE and XLU
- Consumer Staples well inside leading but lacking relative momentum
- Financials turning back into leading from weakening
- Industrials back inside leading after a short rotation through weakening and lagging
- Energy back on track for a move further int the leading quadrant
Avoid Real-Estate and Utilities
 Real-Estate (XLRE) and Utilities (XLU) are the two sectors with the longest tails over the last 5 weeks and they both point to the lower left-hand corner of the Relative Rotation Graph at a negative RRG-Heading (South-West).
In combination with the increase in the length of their tails, this is signaling weakness from a relative point of view.
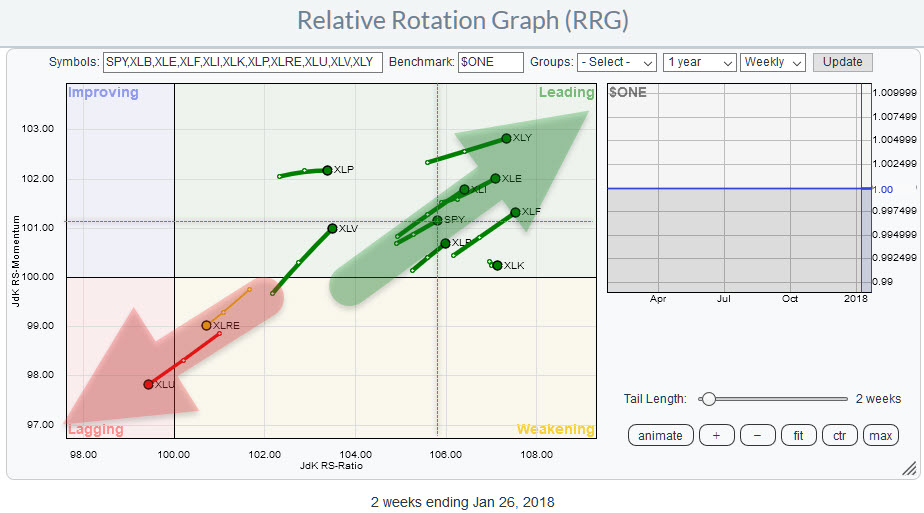
The weakness of XLRE and XLU, or the strength of the other sectors and the S&P 500 becomes even better visible when $ONE is used as the benchmark and SPY is added to the universe.
In this setting, ALL sectors except XLRE and XLU are inside the leading quadrant AND moving further into it. Also, XLRE and XLU are the only two sectors showing a negative RRG-Heading.
At the moment, just by avoiding these two sectors and holding positions in all others (or a Delta-1 position in SPY) you should be able to outperform SPY.
Real Estate select sector fund - XLRE
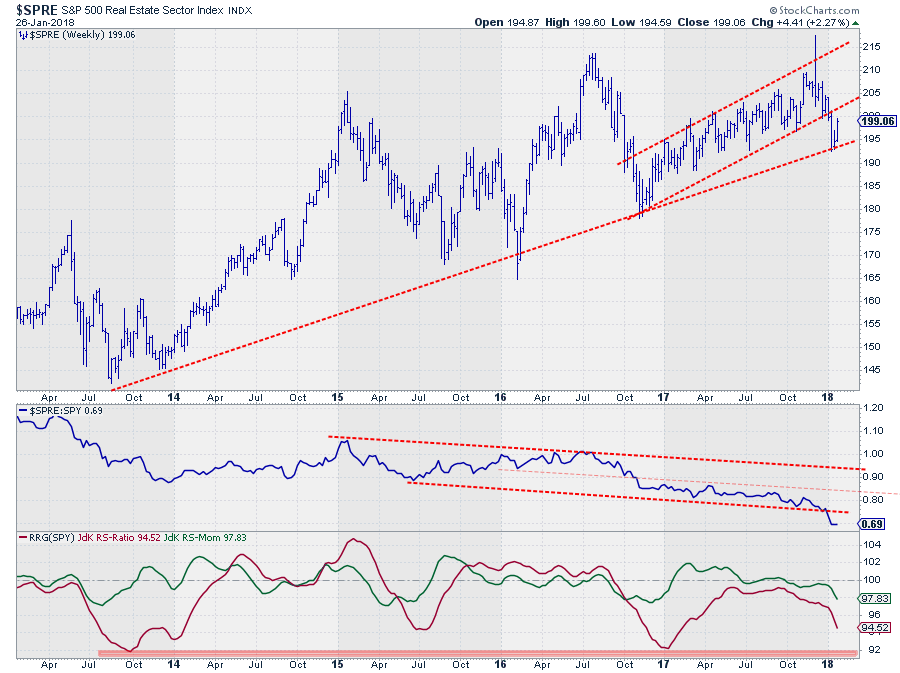 I am using the $SPRE chart as a proxy for XLRE as it holds longer history which enables the visualization of longer trends and patterns. The big picture for Real-Estate still shows the major lows since 2013/14 to be at subsequent higher levels. The major highs (2015, 2016, and 207) are all within a range of less than $ 10 (5%) of each other with the last peak lower than the previous one.
The most recent low was set against the rising trend-line which indicates demand is still coming it at higher levels (positive). However, zooming in on the price action since the beginning of 2017 shows that the rising channel, that was in play from late 2016 onward, was broken a few weeks ago. And, more important, the most recent (=more important) series of higher highs and higher lows was broken.
The current bounce off the long-term rising trend-line now looks like a recovery rally towards the former support line which is expected to act as resistance now, more or less blocking a substantial move higher.
From a relative perspective, the picture looks completely different. The RS-Line against SPY is moving gradually lower already since its early 2015 high and very recently the RS-Line even dropped out of that already falling channel sending a very negative message about the relative strength of Real Estate versus SPY.
The RRG-lines picked up the most recent part of that downtrend since September 2016. The JdK RS-Ratio line remained below 100 ever since, keeping $SPRE (XLRE) at the left-hand side of the RRG. The JdK RS-Momentum line oscillated a bit around 100 and caused two rotations through improving and back into lagging with relative momentum now at its weakest level since late 2016 and moving lower.
All in all a very weak relative outlook and from a price perspective the most recent low ($ 192.50 in $SPRE) is important to watch. A break below that level will trigger a downtrend in price and add extra fuel to the relative downtrend that is already underway.
Utilities select sector fund - XLU
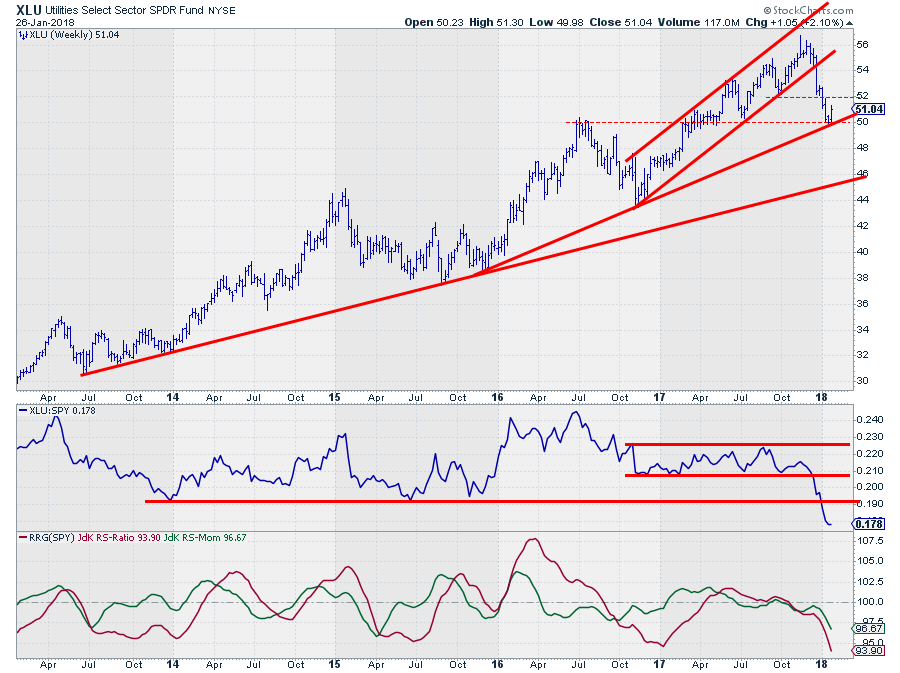 For the utilities sector also the long-term trend in price is still showing subsequent major lows coming in at higher levels. But also the most recent series of higher highs and higher lows was broken at the end of last year and a sharp decline followed the break of the rising support line.
Last week the sector found support at the support line that comes in around $ 50 at the moment. $ 50 is a double support level made up of the rising support line and the level of the 2016 peak which acted as support a few times in 2017 already. $ 52 is now resistance.
A break below $ 50 sill very likely act as the catalyst for a new wave of selling and push XLU towards the rising support line that now comes in around $ 46.
The relative picture over the past years is characterized by predominantly sideways movement with some decent moves/trends that were picked up by the RRG-Lines.
In October last year, both RRG-Lines dropped below 100 and started moving lower in tandem, pushing XLU into the lagging quadrant. After a small recovery in RS, the raw RS-Line dropped out of the narrow trading range and started accelerating towards the long-term horizontal support in relative strength.
That level did not stand a chance and was broke without hesitation, indicating the strength behind the move resulting in a long tail on the Relative Rotation Graph.
The clear negative RRG Heading on XLU suggests that more weakness can be expected.
Inside the leading quadrant
The sectors inside the leading quadrant are all still relatively close to the center of the Relative Rotation Graph which is to be expected as this is a closed universe (all elements/sectors that make up the benchmark are present on the plot) and their vectors from the center of the chart should all add up to zero (0).
XLY has the highest reading on the JdK RS-Momentum scale but is moving due East which means a stable relative trend. XLF, XLI and XLE are all moving at an RRG-Heading between 0-90 degrees making them interesting to watch.
Financials (XLF) and Industrials (XLI) both completed a fairly quick rotation from the leading quadrant through weakening. XLF moved straight back into leading from weakening while XLI needed a bit more time and a rotation through lagging and improving (without actually stopping inside improving).
Both sectors seem ready for another period of market leadership.
Energy select sector SPDR - XLE
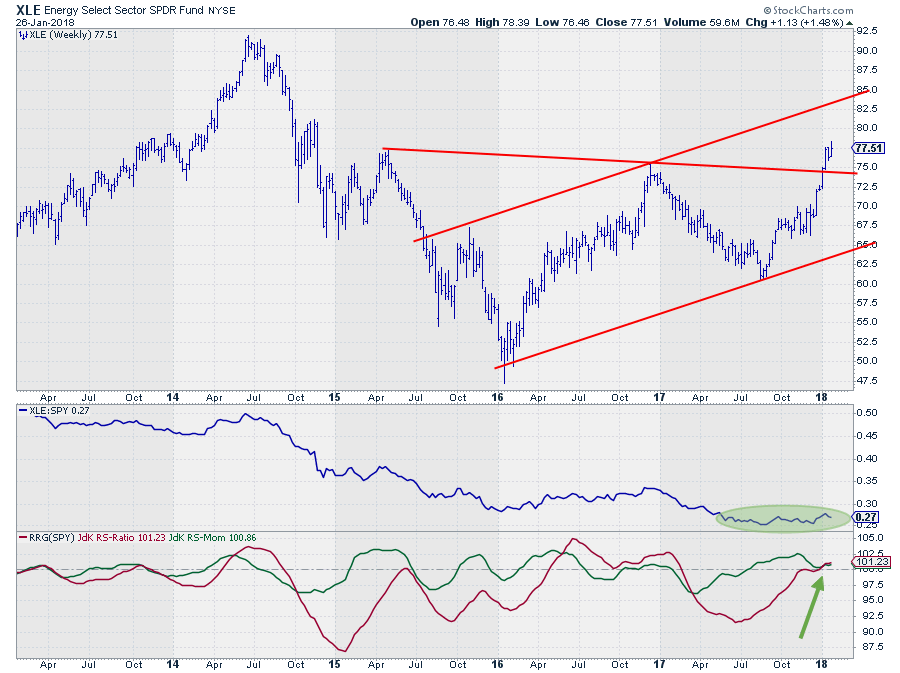 Energy is The XLE chart is the ONLY sector that did NOT push to new all-time-highs in 2017 and for the most part of that year, XLE camped on the left-hand side of the RRG.
Some improvement started to become visible in July when the JdK RS-Ratio line crossed above 100 pushing XLE into the improving quadrant. As RS-Ratio was still at very low levels at that time it took some time for the RS-Ratio line to catch up and get closer to the 100-level. For a brief period, it looked as if the rotation could continue into the leading quadrant but there was not enough (relative) momentum left to really make XLE push into the leading quadrant.
During this whole period, the raw RS-Line started to level off after a decline in the first months of 2017 and a bottom formation looks to be in the making (in the green shaded area). As relative strength held up well the RS-Momentum line managed to bottom out against the 100-level and just recently started to rise again together with the RS-Ratio line.
This offers a lot of potential as the RRG-Lines have only just crossed above 100 leaving a lot of upside potential available. An upward break from this consolidation/bottoming pattern will be the confirmation of a further relative improvement.
Improvement is now definitely visible on the price chart as well where XLE just broke above an important (almost) horizontal resistance level connecting two major highs (2015 and 2017). This makes the area around $ 75 support while there is plenty of upside potential available on the price chart.
Let me know what you think of this usage of RRG in the comments? If you want to receive a notification when a new article in the RRG blog is published? Simply "Subscribe" and leave your E-mail address.
Julius de Kempenaer | RRG Research
RRG, Relative Rotation Graphs, JdK RS-Ratio, and JdK RS-Momentum are registered TradeMarks ®; of RRG Research
Follow RRG Research on social media:
If you want to discuss RRG with me on SCAN, please use my handle Julius_RRG so that I will get a notification


