An inspection of the weekly Relative Rotation Graph for US sectors at the beginning of this week (ending 2 March) reveals that we have:
- 3 sectors in leading
- 2 sectors in weakening
- 4 sectors in lagging
- 1 sector in improving
Out of these 10 sectors, we have only 2 at a heading between 0-90 degrees (1 in improving and 1 in weakening) while 2 others are between 180-270 (1 in lagging and 1 in weakening)
In this post, I will focus on the individual stocks in the Technology sector which is inside the weakening quadrant on the RRG but curling back up towards the leading quadrant at a positive RRG-Heading. Usually, this is a strong sign and suggests a renewed entry into the leading quadrant. Let’s see if we can find some interesting charts, either positive or negative.
Summary
- XLU and XLRE remain wewak
- Avoid XLP and XLE from a sector perspective
- XLY/XLP ratio continues to support a risk-on approach to market
- Better to avoid AVGO, GLW, ADP, VZ and PAYX
- Opportunities for CRM, RHT, ADBE and NVDA
From a sector perspective
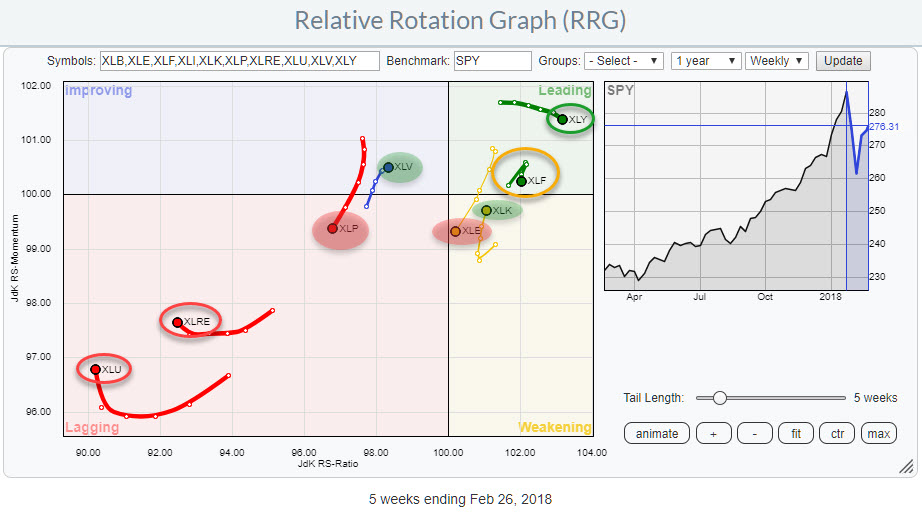
At sector level, XLU and XLRE are still very deep inside the lagging quadrant and in (strong) relative downtrends. The recent slightly curling upward movement is not meaningful enough (IMHO) to put them on the radar for potential outperformance on a longer-term horizon.
The negative heading on the tails of XLP and XLE suggest that more downside (relative) movement can be expected for those sectors.
XLP is moving back into lagging after a rotation through improving. This implicates a new leg down in an already declining relative downtrend.
XLY is the strongest sector inside the leading quadrant despite the RRG-Heading rolling into the 90-180 area.
The fast rotation down on the tail of XLF is a bit disturbing and deserves our attention going forward.
On the Relative Rotation Graph, XLV and XLK are heading higher on both axes which causes their RRG-Heading to be positive (0-90 degrees). The fact that XLK is showing this type of rotation inside the weakening quadrant makes it the sector to investigate further and look at some individual stocks inside that sector.
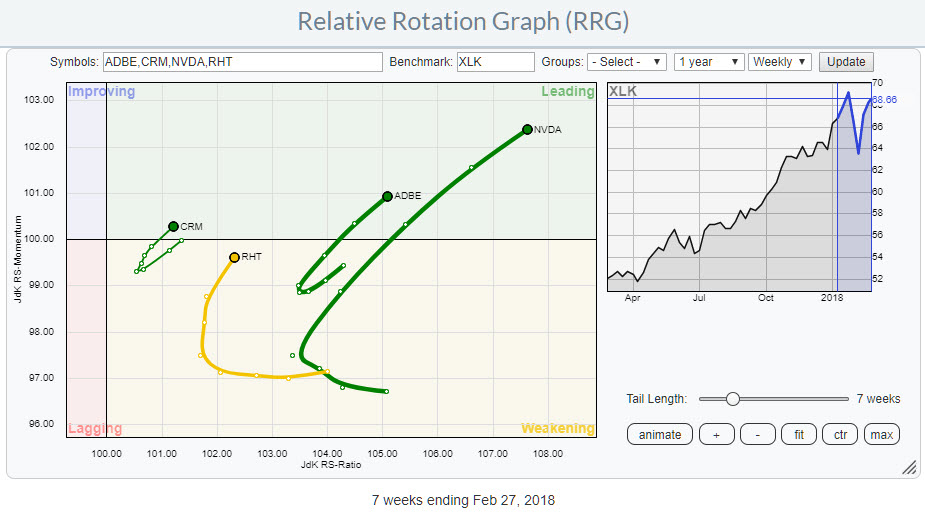
A look at individual stocks on a Relative Rotation Graph
The animation shows how I use RRG on Stockcharts.com to quickly scan through a universe of individual stocks, in this case, the technology sector (XLK), to find names that I want to have a better look at.
The steps that I execute are:
- Load universe of stocks with appropriate benchmark, in this case XLK holdings against XLK as the benchmark
- Zoom the RRG to fit all tails on the canvas
- Add a bit of space on the edges of the RRG using the +/- buttons
- Sort the universe on the tail column, this makes it possible to cycle through the universe from quadrant to quadrant, instead of jumping all over the place
- Select the first ticker in the table to make it stand out on the plot
- Use Ctrl-Dn to toggle through the list of securities and inspect their tails
- Pick the names you want to analyze further on regular charts.
Stocks to avoid
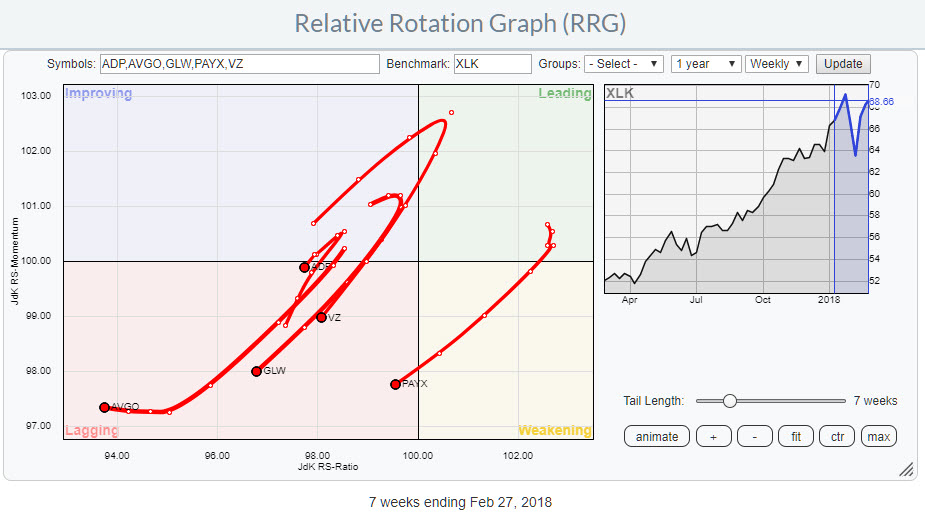 From cycling through the individual members of the technology sector I picked the following five stocks which are best avoided from a relative perspective.
They are all inside the lagging quadrant and on an RRG-Heading between 180-270 causing them to move lower on both axes at the same time.
Broadcom Ltd. - AVGO
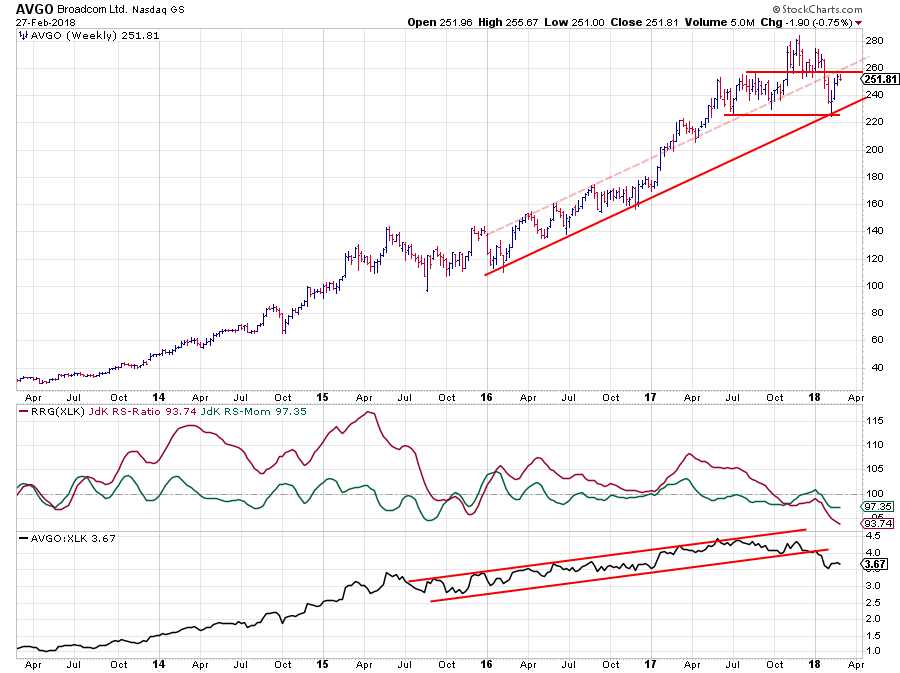
Broadcom recently set a lower high on the price chart and then dropped back into its old rising channel. The last bounce off the lower support line is now getting into trouble at the level of the (old) rising resistance line and the previous low.
More upside will be very difficult going forward while there is little support until levels around $ 230.
The biggest danger for AVGO comes from its relative position. It broke the relative uptrend towards the end of 2017 and has now begun to form a series of lower highs and lower lows on the RS-Line keeping both RRG-Lines below 100 and pushing the stock further into the lagging quadrant.
Corning, Inc. - GLW
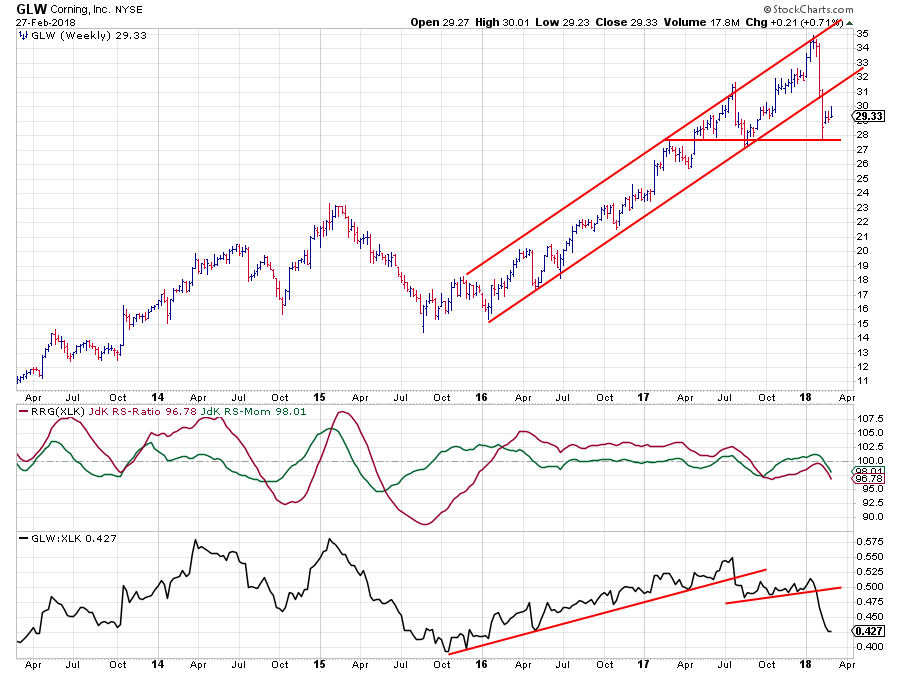
The sharp decline off of the top at $ 35 caused GLW to break out of its rising channel on the price chart. For the time being support at $ 28 has held up. Question is “for how long?”. A break below that support level will very likely cause, another, acceleration down.
Relative strength is weak since July last year when a rising trend was broken. Very recently RS also broke below support from a consolidation pattern that formed in the second half of 2017.
With the RRG-Lines already below 100 since September, this new decline has to be seen as a renewed leg down in an already declining relative trend.
Automatic Data Processing, Inc. - ADP
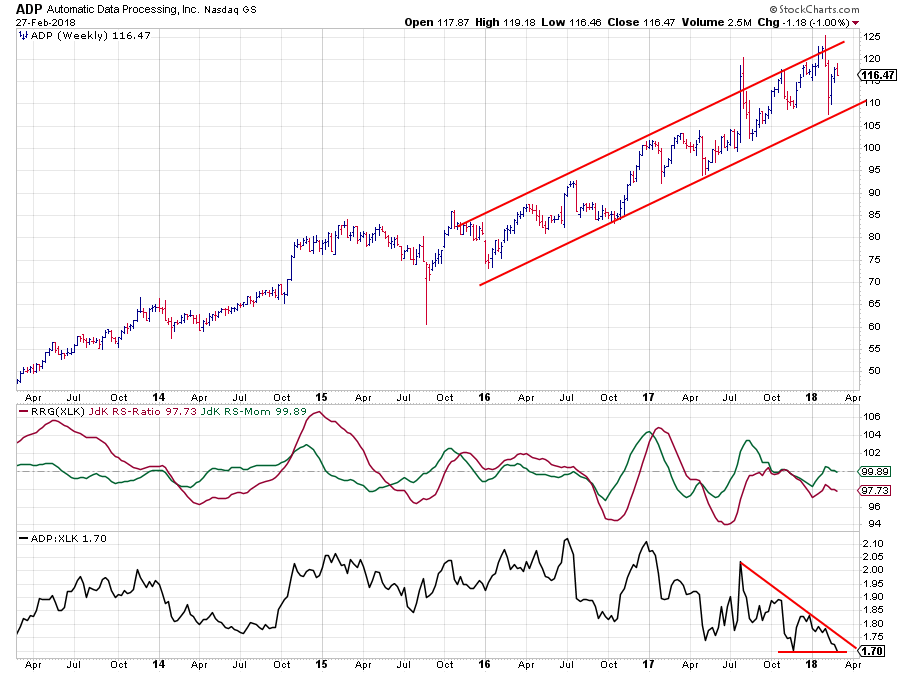
From a price perspective, the uptrend in ADP is still intact but the relative strength against XLK is on the verge of breaking down.
The RRG-Lines picked up a relative downtrend in early 2017. The improvement in the second half of 2017 was not strong enough to push the stock back into the leading quadrant and the tail rotated back into lagging.
At the moment the raw RS-Line is pushing against the level of its previous low. A break lower will push ADP deeper into lagging and cause more underperformance going forward.
Verizon Communications - VZ
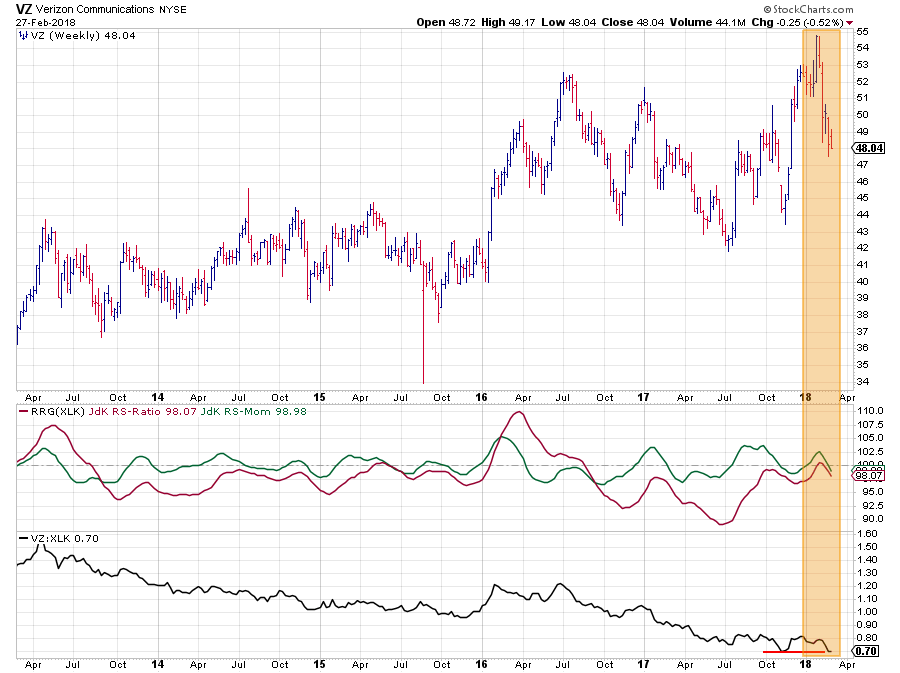
The chart of VZ does not offer any clear support or resistance levels nor any clear trends. The relative picture, however, is worrisome.
The RS-Line started sliding mid-2016 and is currently testing last year’s low. Breaking this level will very likely cause the momentum in the downtrend to pick up again and push VZ lower relative to XLK.
Paychex, Inc. - PAYX
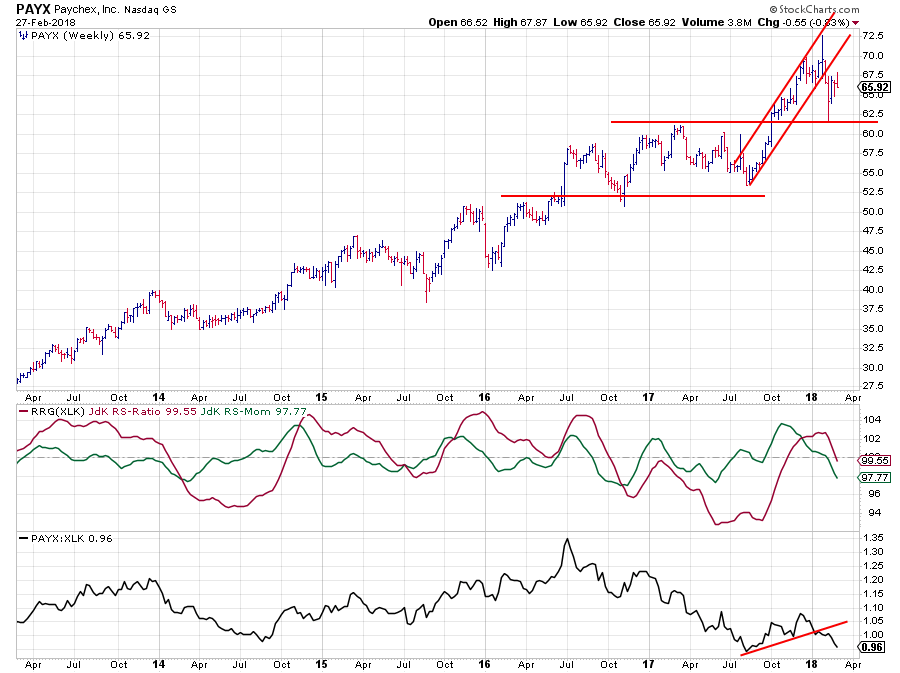
PAYX has only just pushed into the lagging quadrant from weakening. The positive rotation during the last few months of 2017 and into 2018 was caused by the upward break in the price chart that pushed PAYX price higher.
As you can see in the chart it was not able to keep up this positive momentum in price and a few weeks ago the short-term rising channel was broken and PAYX tested the former resistance level as support.
If a lower high will be put into place in coming weeks and support around $ 62 gives way we have to expect a further drop, possibly towards the $ 52.50 - $ 55.00 area.
The RS-Line just broke a short-term support level and started to head lower again making the RRG-Lines move below 100 and push into the lagging quadrant. Watch out for a new period of underperformance.
Potential outperforming stocks
From a number of stocks showing strong rotations on the Relative Rotation Graph, I have picked four of which I think that they are looking particularly strong and have good upside potential.
The primary reason for focussing on these names is the fact that they all have rotated from leading through weakening and are now back inside or just about to enter the leading quadrant again.
Salesforce.com, Inc - CRM
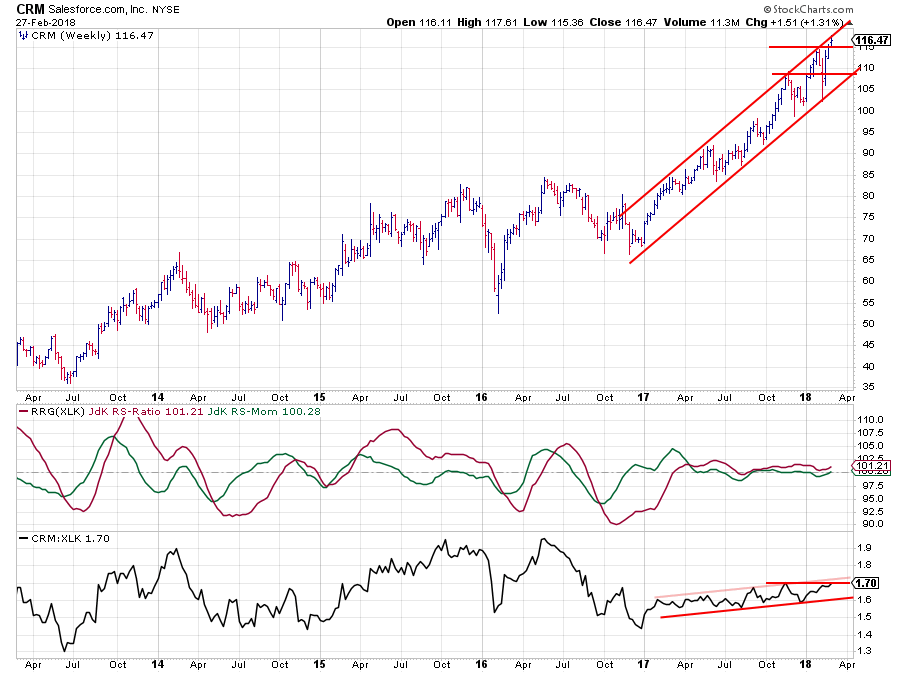
CRM is not the tail that stands out most on the RRG, primarily because it has a relatively short tail and it is rotating close to the benchmark (center of the chart) which causes it to “get lost” between all the other stocks in and around the center of the RRG.
However, when zooming in a bit more it becomes visible that CRM has just rotated, for a short period, through weakening but very rapidly rotated back into the leading quadrant.
These are the stocks I am interested in because they are already in a relative uptrend and they have completed a pull-back in that new trend and they are now lining up for the next move higher (relative).
Looking at the chart above we see that the trend in price is still solid and CRM has just broken to new highs. The only thing is that it is now touching the upper boundary of its channel which could cause some price pressure in coming weeks.
The RS-Line is in a shallow uptrend since early 2017 and now pushing to break above its previous high. So far the RRG-Lines have stayed close to the 100-level but when RS manages to break higher CRM will likely be in for a significant rise in relative terms against XLK.
Red Hat, Inc - RHT
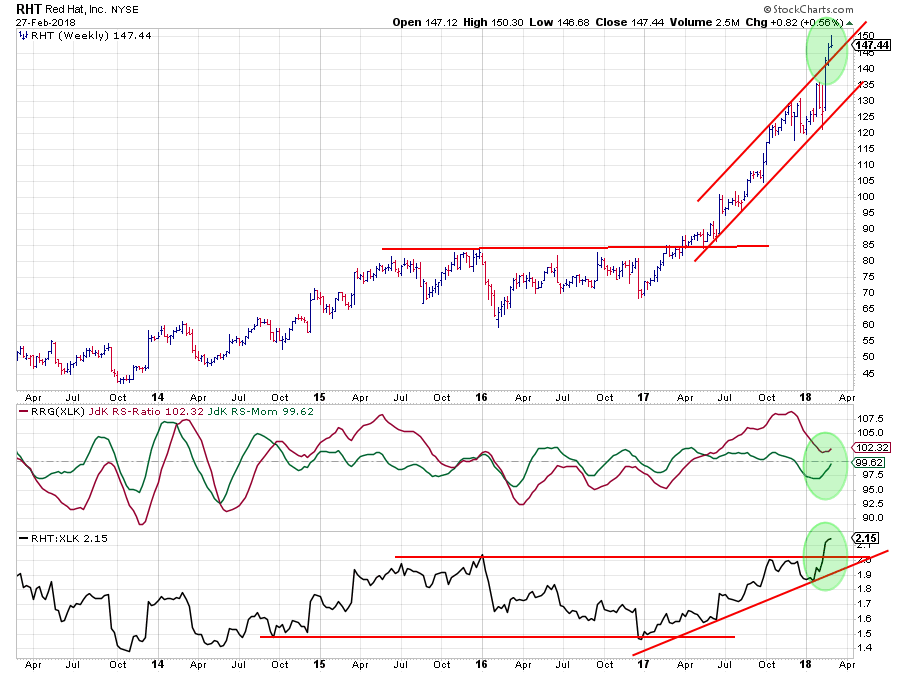
Red Hat started to roll over inside the leading quadrant sometime in November last year and went through a large rotation from leading into weakening. This is the sideways/topping behavior that is seen in the RS-line.
A few weeks ago the RS-line put in a new, higher, low and subsequently broke above its horizontal resistance level clearing the way for more relative (out-)performance.
Following this break, he RRG-Lines have now turned up again with RS-Ratio remaining above the 100-level (inside the weakening quadrant).
The resulting rotation can be seen on the RRG where RHT is now positioned inside weakening but at a strong RRG-Heading pushing higher. Another move into the leading quadrant seems only a matter of time.
Adobe systems Inc. - ADBE
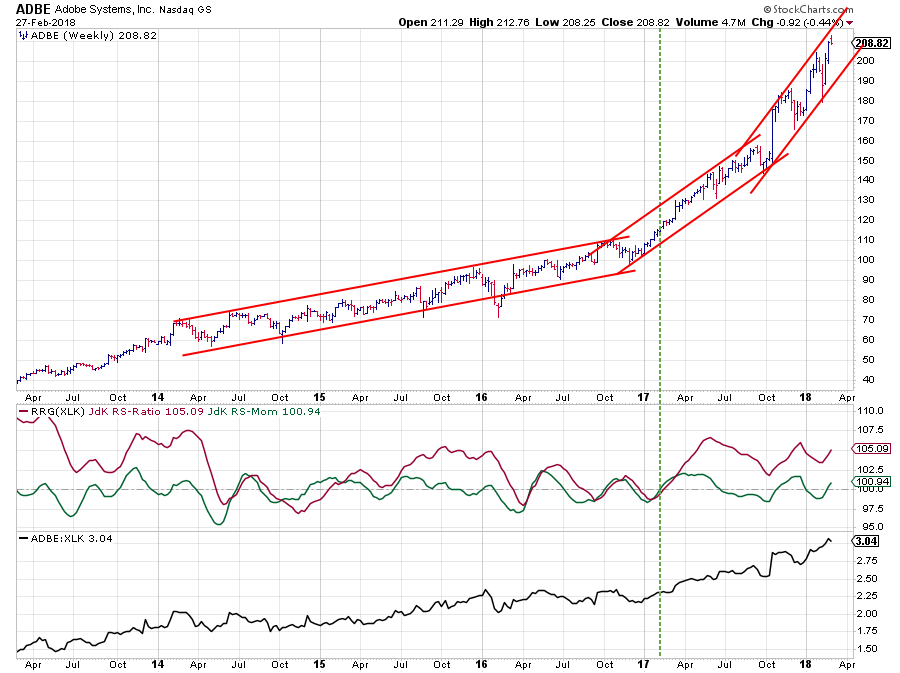
The price chart of ADBE is characterized by trend channels that get steeper every time with the most recent one starting in October of last year.
The most recent rally in RS started at the beginning of 2017 and is still fully intact and during the first few weeks of 2018 ADBE managed to push to new relative highs against XLK.
The RS-Ratio line is comfortably moving above the 100-level and the last dip in relative momentum (RS-Momentum line < 100) was captured well before RS-Ratio would drop below 100 as well.
This puts ADBE inside the leading quadrant at a strong RRG-Heading and makes it one of the strongest stocks in the technology sector at the moment.
NVIDIA Corp. - NVDA
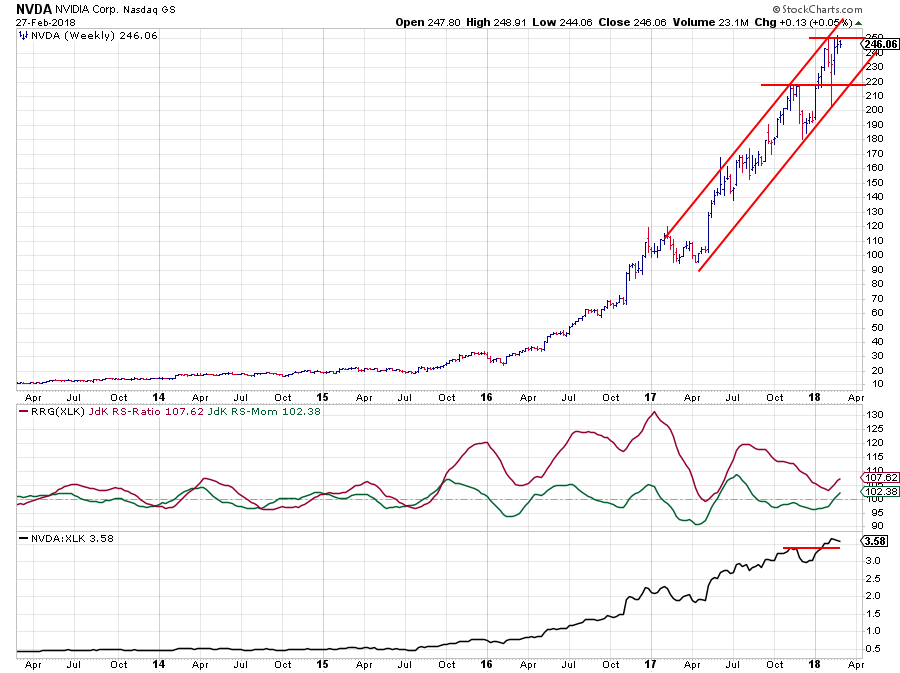
Another strong name in technology. A stock price that is still well within the boundaries of a steeply rising channel and pushing to new highs.
The relative trend managed to take out its recent high, confirming the upward momentum that is still present in this ratio.
The combination of a strong trend in price and a strong trend in relative strength causes a powerful rotation into the leading quadrant for NVDA and warrants the expectation for an ongoing out-performance in coming weeks.
Let me know what you think of this usage of RRG in the comments? If you want to receive a notification when a new article in the RRG blog is published? Simply "Subscribe" and leave your E-mail address.
Julius de Kempenaer | RRG Research
RRG, Relative Rotation Graphs, JdK RS-Ratio, and JdK RS-Momentum are registered TradeMarks ®; of RRG Research
Follow RRG Research on social media:
If you want to discuss RRG with me on SCAN, please use my handle Julius_RRG so that I will get a notification.


