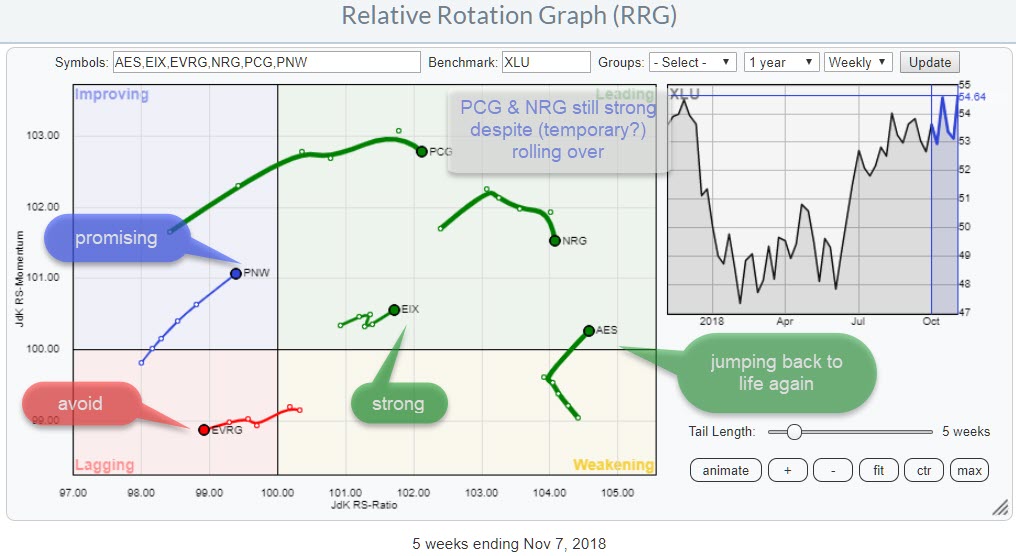
The relative rotation graph above shows a selection of stocks in the utilities sector. I have created this zoomed in version for better visibility. The fully populated RRG can be found here.
In this post, I will highlight a few of the stocks shown in the picture. As XLU is now one of the sectors inside the leading quadrant vs SPY and continuing higher on both axes. I will focus on a few names that are expected to fuel further relative strength in utility stocks but also point to one that is better avoided.
Summary
- Utilities sector pushing further into leading quadrant vs SPY
- EVRG is better avoided as it is one of the weak names inside a strong sector
- AES continues its rally but risk/reward is unfavorable for new positions
- EIX is ready to break higher on RS chart
- PCG on the verge of completing big double bottom formation
- NRG took out important resistance on monthly chart and continues higher while waiting for a break in relative strength
Evergy Inc. - EVRG
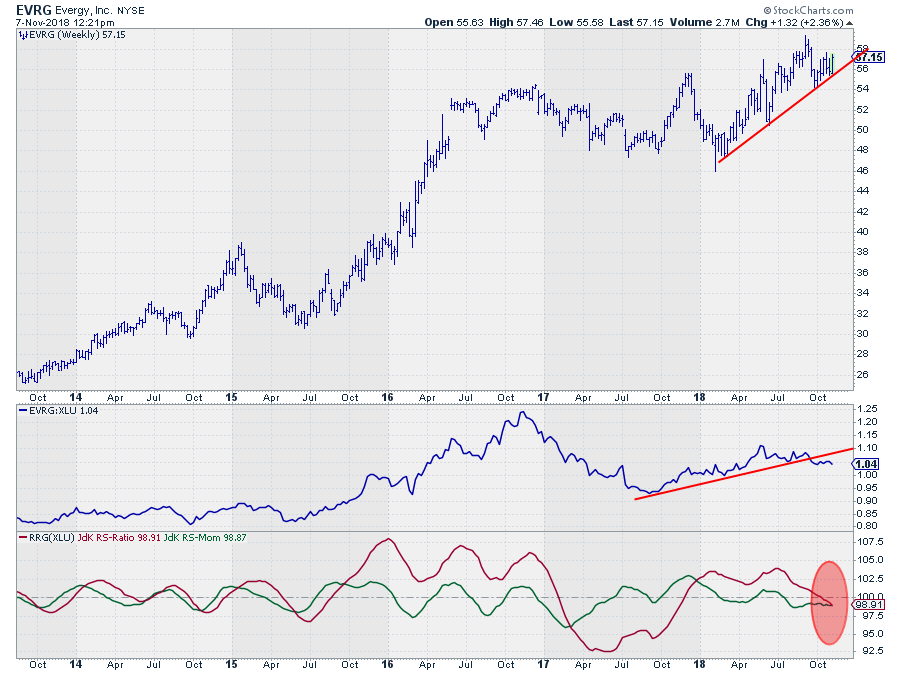
Evergy is well inside the lagging quadrant at the moment and with a negative RRG-Heading, the stock is moving lower on both axes, pushing it deeper into negative territory.
The price chart is still holding up relatively well above its rising trendline but there has been very little to no momentum over the past two years and it is hard to see any strong momentum emerging at short notice.
The real pain is coming from the RS-Line that has broken below its rising support line and the RRG-Lines which are now both below 100 and pushing lower at a steady pace.
Although utilities is one of the stronger sectors at the moment, EVRG is better avoided. There are better options in this space.
AEX Corp. - AES
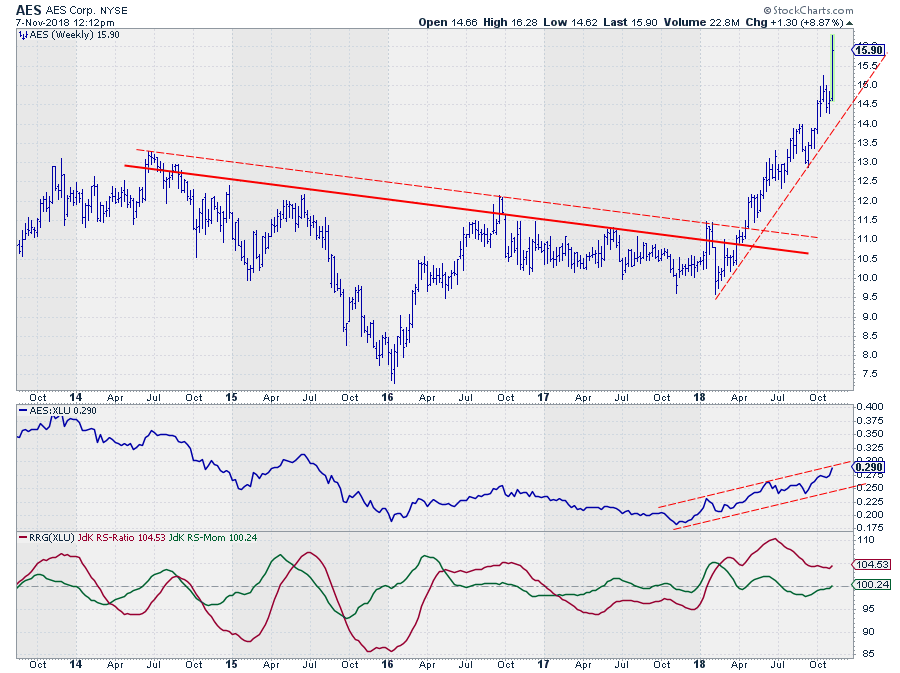
Inside the leading quadrant, AES stands out as it is the stock at the highest JdK RS-ratio level that just went through a leading-weakening rotation and now jumped back into leading with a strong hook. This relative trend is not over yet!
The RRG below is based on daily data and zoomed in on AES. It is clearly visible that the strange "hook" that we see on the weekly RRG translates in a nice clockwise rotation at the right-hand side of the RRG (=strong move).
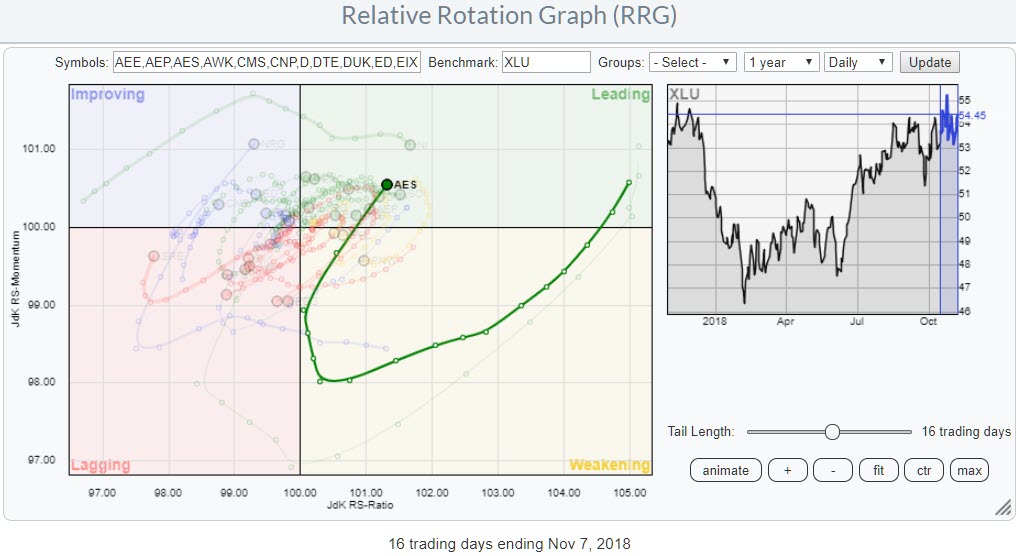 The question is if this is an appropriate level to get on board with this stock if you do not already own it.
Given the steep rise since the beginning of the year and the jump that we are seeing this week, I'm afraid that risk/reward for new positions is not favorable anymore at these levels. But it is not a sell!!!
Edison Intl - EIX
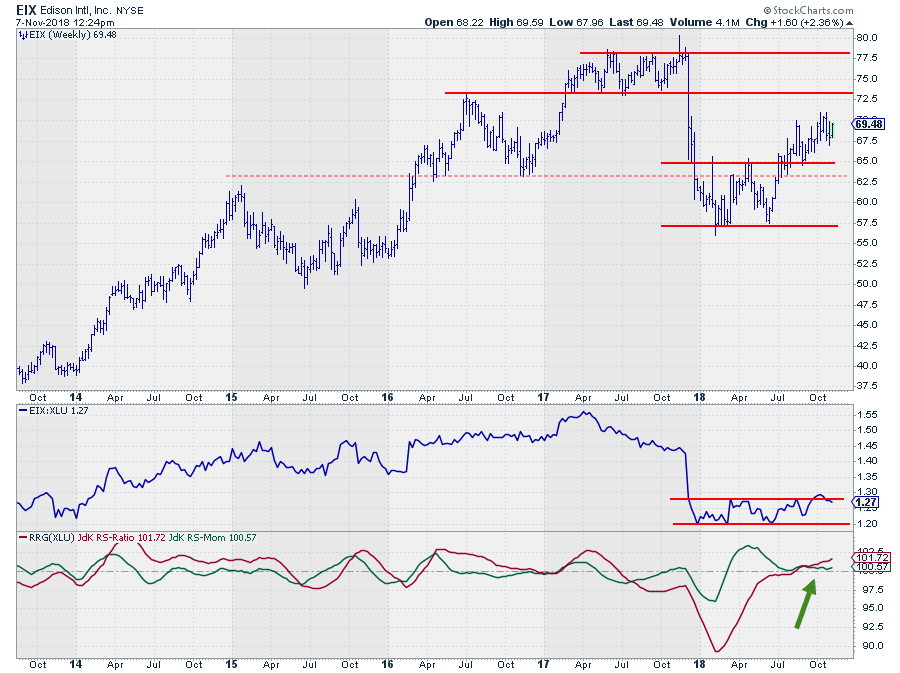
EIX completed a double bottom formation which stretched over the first six months of this year. Breaking above resistance at $ 65, completed the pattern and sent the price higher. The first resistance level I am watching now is near $ 72.50 where some old highs and lows are lining up.
The RRG-Lines have already detected a new relative uptrend. The RS-Ratio line is steadily moving higher with RS-Momentum moving sideways/stable just above 100. This means that the momentum is steady, not improving nor deteriorating.
The raw RS-Line bounced off support a few times this year after a steep decline at the end of 2017. At the moment EIX's relative strength is challenging its horizontal resistance level.
Once this barrier is broken more relative improvement can be expected. Such a break will very likely provide the fuel that is needed to get RS-Momentum rising and pushing EIX faster and further into the leading quadrant.
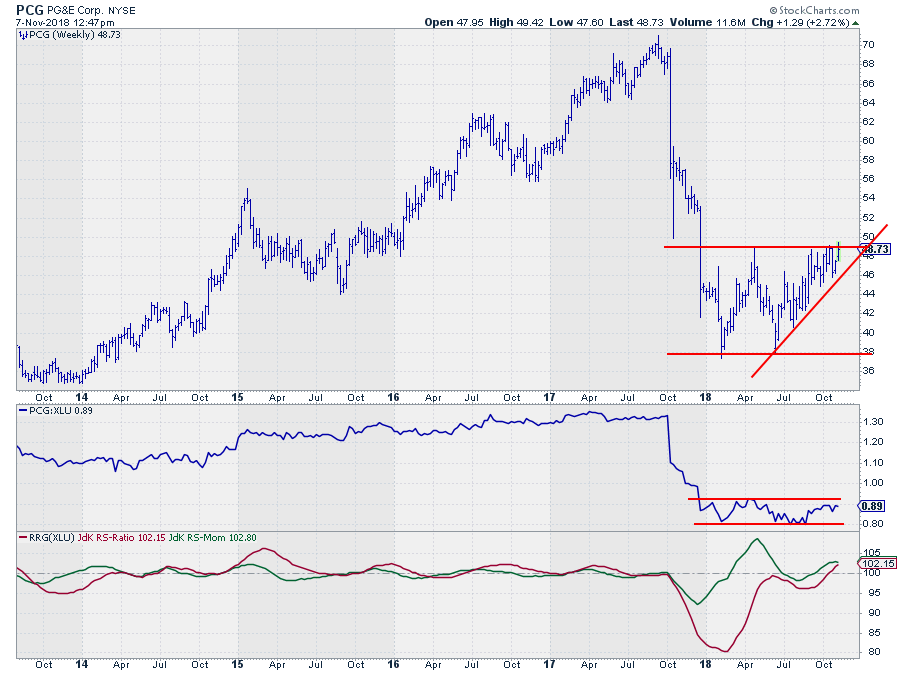
PG&E Corp. PCG
PCG's price chart is very interesting as it is very close to completing a very large double bottom formation, just like we have seen it in EIX but potentially with a bigger impact. The price target that can be calculated after EIX breaks resistance at $ 49 lies around $ 58/59 which a serious rally from current levels.
Just like on the EIX chart, the RRG-Lines here also have picked up a new relative uptrend by positioning PCG inside the leading quadrant. The small flattening of the RS-Momentum line caused the trail on the RRG to roll over mildly but the stock remains comfortable inside leading.
The trading range in the relative strength chart needs to be broken upwardly for the move to accelerate and get the RRG-heading back into the right direction (0-90 degrees).
All in all, things are looking good for PCG but we need a break above $ 49 in price and above ~0.9250 in the PCG:XLU ratio for things to remain good and become even better.
NRG Energy Inc. - NRG
 The other stock that I high-lighted, inside leading but rolling over, is NRG. This one particularly interesting as it just broke above a resistance level ($35) coming off the previous high from 2014 which also marked an important level on the monthly chart.
The recent throwback shows a good example of old resistance becoming new support and a higher low within the boundaries of the rising channel was set, opening up the way for more upside movement. On the monthly chart the next resistance level to watch is around $41.
The relative strength for NRG is in a steady moving uptrend and now pushing against resistance off of the two most recent highs. This barrier needs to be broken for RS to be able to continue higher and for the RRG-Lines to get more comfortable above 100 and moving further into the leading quadrant.
Let me know what you think of this usage of RRG in the comments below. If you would like to receive a notification when a new RRG blog article is published, simply "Subscribe" with your email address using the form below.
Julius de Kempenaer | RRG Research
RRG, Relative Rotation Graphs, JdK RS-Ratio, and JdK RS-Momentum are registered TradeMarks ®; of RRG Research
Follow RRG Research on social media:
If you want to discuss RRG with me on SCAN, please use my handle Julius_RRG so that I will get a notification.

