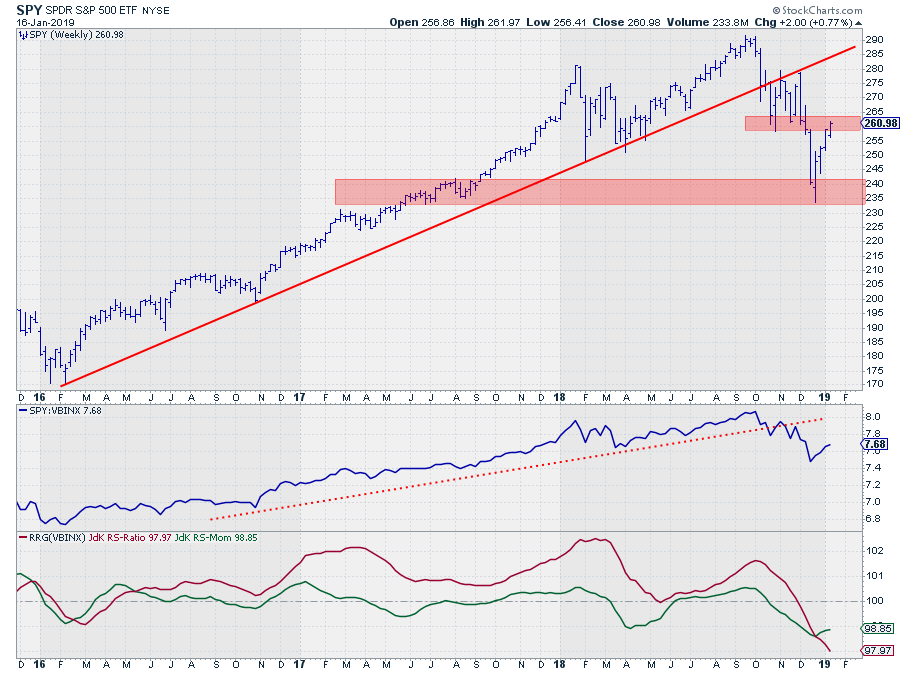
After the sharp sell-off in Q4 of last year, the market (SPY) started to recover from its lows near 235. And IMHO it is still a "recovery" before turning down again as opposed to a "turnaround" back up.
This weekly chart above clearly shows that the rhythm of lower highs followed by lower lows is still in play and for a turnaround to become a possibility we need, at the minimum a first higher low, i.e., above 235 or a new high, i.e., above 280, to be put into place.
Either possibility will take both time and strength.
For the time being SPY has just entered "Trouble Territory"
Trouble Territory On The Relative Rotation Graph
It is not only on the price chart that SPY is entering trouble territory. Below is the weekly RRG for asset classes. With SPY highlighted.
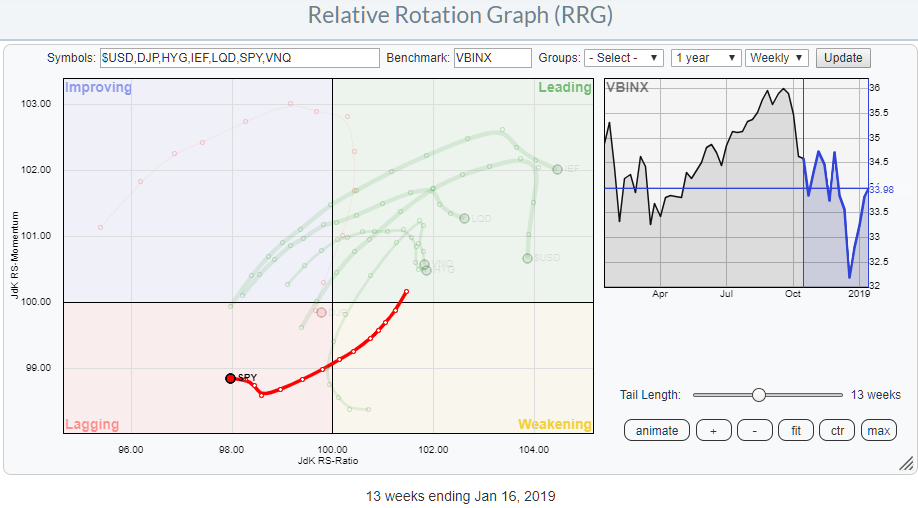 For a few weeks already SPY, stocks, is the only asset class that is rotating inside the lagging quadrant. This week Commodities (DJP) seem to be joining the party.
Click on the RRG image and open the live version to see the rotations of the other asset classes better.
Although the other asset classes in the leading quadrant are rolling over downward, they are so far away, to the right, of the benchmark and even further away from SPY that we have to regard this rotation as a countertrend move for the time being. With the "trend" being that stocks are moving further down on the Jdk RS-Ratio scale and the fixed income related asset moving higher on the horizontal axes.
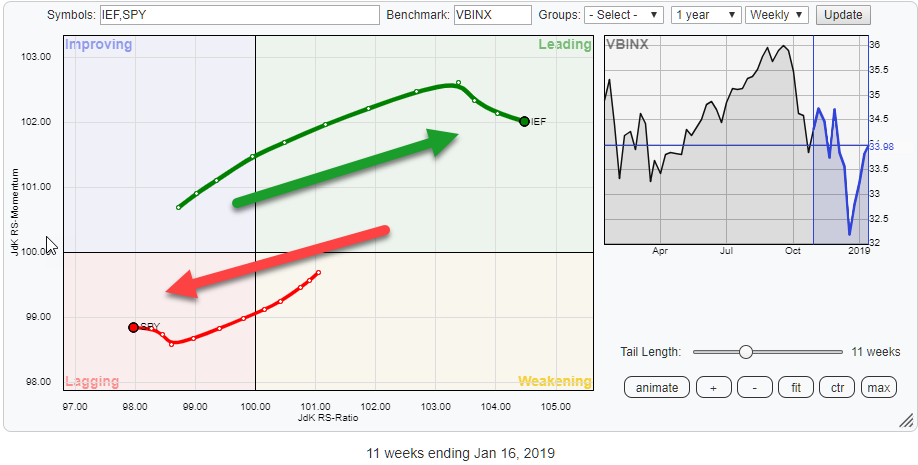
Jumping from the weekly to the daily version of the RRG chart provides a different picture.
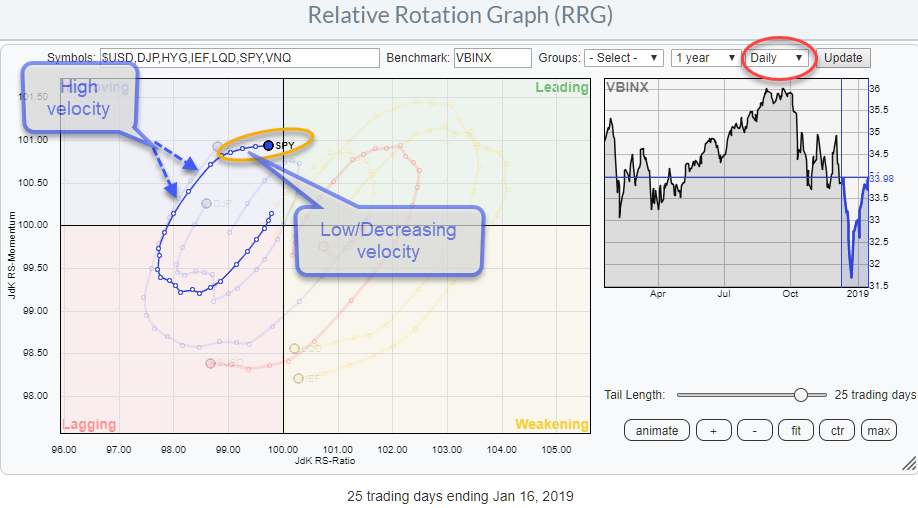 Here we see SPY still inside the improving quadrant but very close to crossing over into leading.
With a weekly rotation solid inside lagging, I always approach these daily rotations with caution as there is a good chance that they may be a recovery rotation within the longer term downtrend.
And that seems to be the case here. Especially when we zoom in on what's called RRG-Velocity. That is a metric that looks at the distance between the observations on the tail.
The longer the distances between the observations, high velocity, the stronger the move. When RRG-Velocity is high a turn is less likely (because of the power). When RRG-Velocity is low(er) or decreasing as it is right now on the tail of SPY the odds for a turn are increasing.
Hence in this situation, we have a tail for SPY that is showing decreasing RRG-Velocity while also moving at an RRG-Heading close to 90 degrees, due South. Which means that the increase in relative momentum that was present during the rotation from lagging into and through improving is waning and almost gone.
The decreasing RRG-Velocity, the RRG-Heading close to leaving the 0-90 degree area while still inside the improving quadrant make this troubled territory for SPY on the (daily) RRG as well. The odds seem to be in favor of a continuing rotation sideways and then downward again, bringing the daily rotation in sync with the weekly picture again.
SPY Daily price bars
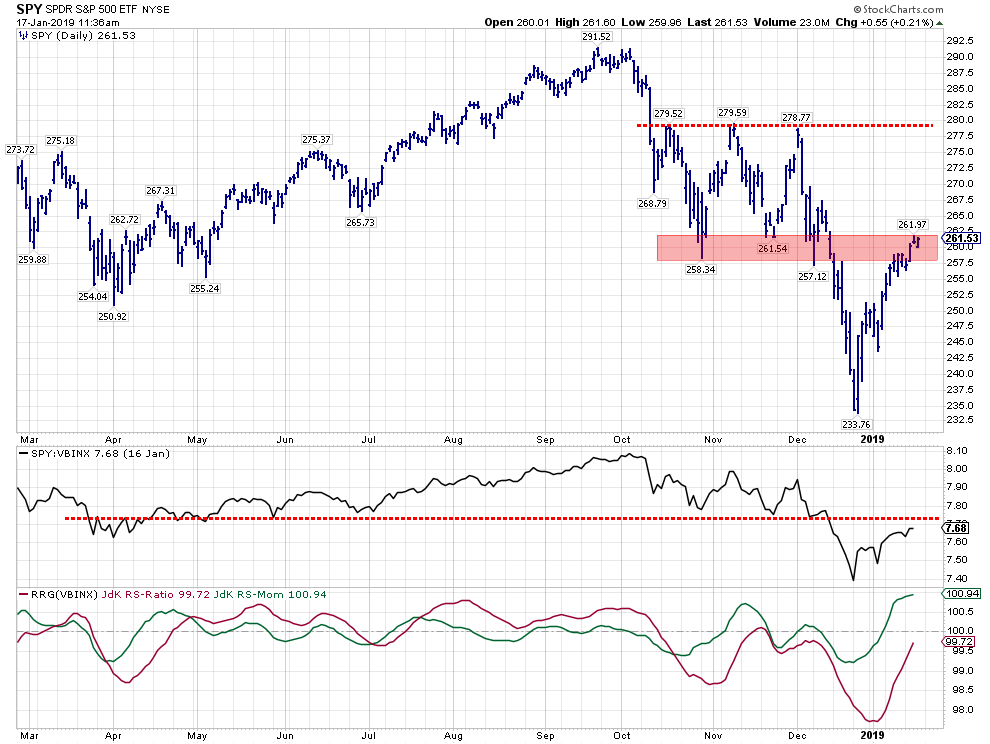
As a final confirmation, here is the daily chart of SPY. The red bar highlights the area where the market previously found support at 258.34, 261.54, and 257.12. After the break lower in December these points or rather this area may be expected to provide resistance.
Why? Put yourself in the shoes of someone who bought a nice position in SPY at either of these lows and is still holding that position. A lot of them, if not all, will be happy when they are able to unload at break-even levels or at a small(er) loss than they were facing a few weeks ago.
Bonds (versus stocks)
When I work on the RRG for asset allocation I also always keep an eye on the rotation for IEF. And at the moment SPY and IEF continue to move in almost exactly opposite directions on both the weekly and the daily RRG charts.
 In my last article of 2018 I wrote more in-depth about that relationship and tried figuring out what levels are needed for both IEF and SPY for their ratio to reach certain support (or resistance) levels.
Since then the dynamics of both instruments changed a bit and are providing us with a new(er) picture that will likely impact the motion on the SPY/IEF ratio as well.
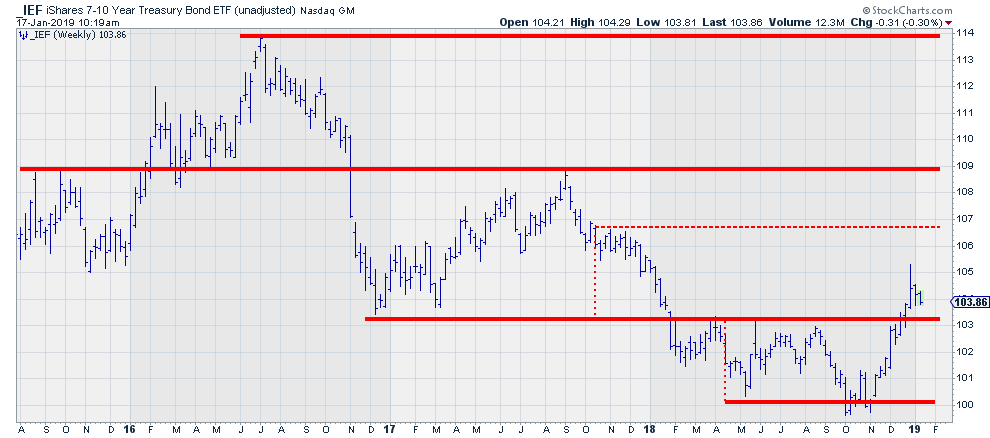 The break of (unadjusted) IEF above resistance near 103 is still holding up after peaking at 105.31.
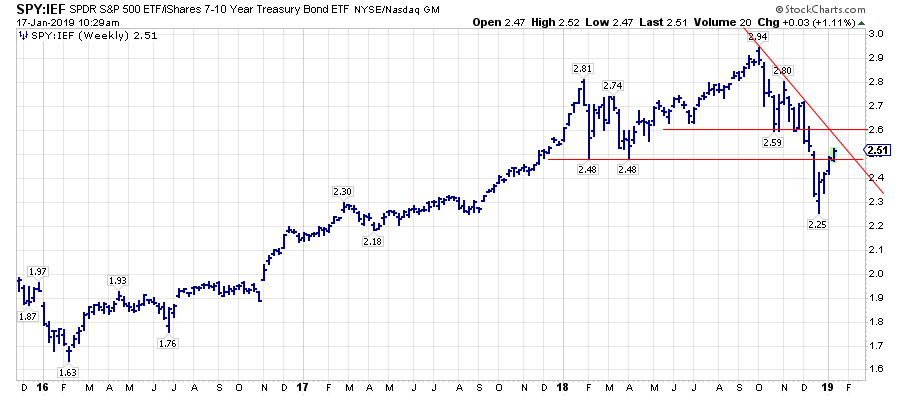
As long as that level holds I am still looking for the SPY/IEF ratio to levels around 2, currently it is at 2.51.
A potential danger that I can see is on the daily _IEF chart.
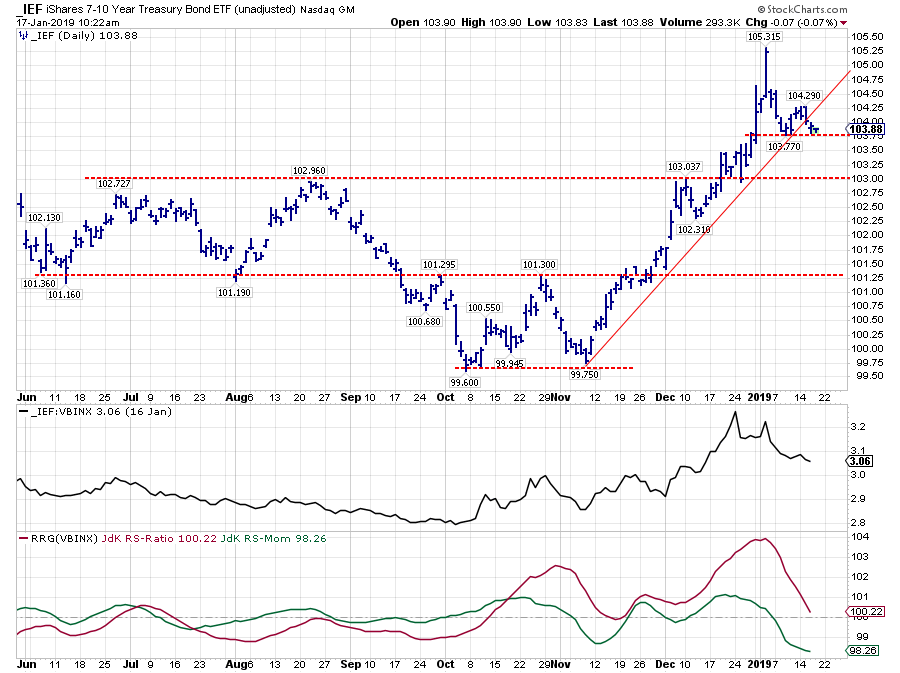 After the spike to 105.31, a lower high has been put into place and the market is now threatening to break the previous low near 103.75. Although there is still some extra room towards 103.00 where LT support is, a break below this previous low will negate the current uptrend (series of higher highs and higher lows) and cause different dynamics for the SPY/IEF ratio.
 In that previous article, I presented a tabular way to relate the SPY/IEF ratio back to potential levels for both elements.
An updated version of this table is shown below.
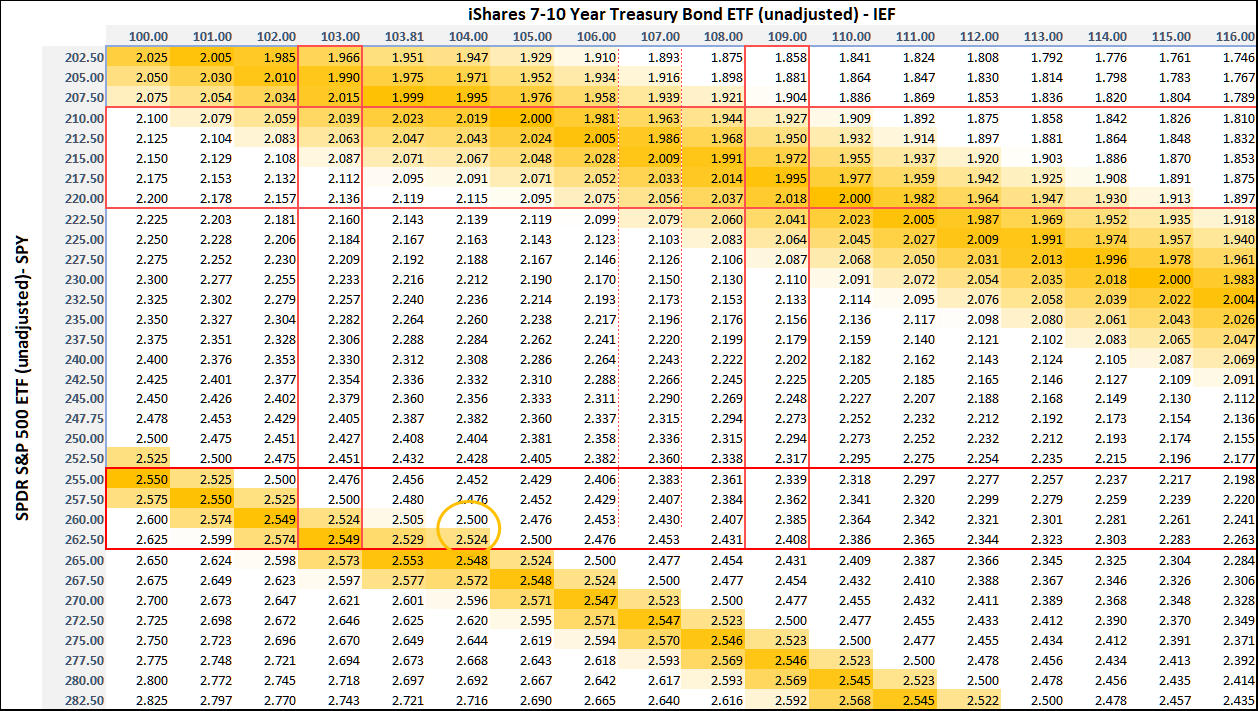 In this table, you can see the levels where IEF and SPY should remain or go for the ratio to remain below its resistance around 2.5 or reach its LT support level/target near 1.9.
For now, I am going to assume that the ratio will remain between its support (~2) and resistance (~2.55) levels which implies that SPY and IEF need to remain between the orange shaded areas in the table above.
Let me know what you think of this usage of RRG in the comments below. If you would like to receive a notification when a new RRG blog article is published, simply "Subscribe" with your email address using the form below.
Julius de Kempenaer | RRG Research
RRG, Relative Rotation Graphs, JdK RS-Ratio, and JdK RS-Momentum are registered TradeMarks ®; of RRG Research
Follow RRG Research on social media:
If you want to discuss RRG with me on SCAN, please use my handle Julius_RRG so that I will get a notification.


