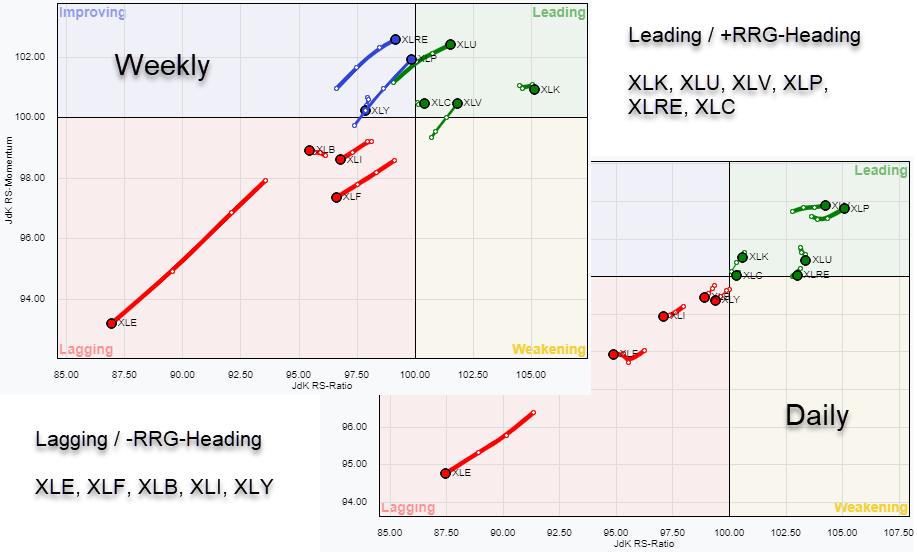
The US sector universe is split pretty much evenly around the benchmark SPY. That is normal. It is also split pretty distinctively in sectors that are inside the leading quadrant and/or traveling at a positive RRG-Heading, which means that they are in a relative uptrend vs. the market. Under current circumstances, this means they falling less fast than SPY vs. sectors that are inside the lagging quadrant and/or traveling at a negative RRG-Heading.
Such a clear split in the direction of the rotations is not uncommon, but it certainly does not happen all the time. It is showing that the market has clearly chosen a direction, in this case with "defensive" sectors in leading and/or at a positive RRG-Heading that signals a risk-off approach.
What IS unusual is that an almost identical rotational picture occurs on both the daily and the weekly RRGs at the same time. Both time-frames are almost perfectly in-sync, which means that they are enforcing each other.
Weekly
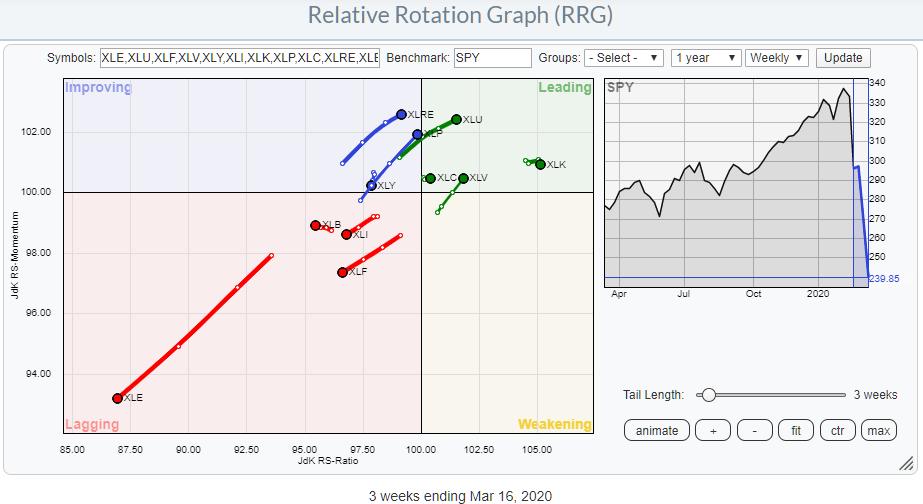
On the weekly RRG, the strongest rotation is found for XLE inside the lagging quadrant. This sector moved from weakening into lagging in September 2018 and has remained at the left side of the chart since then, with a few rotations from lagging to improving and then back to lagging again. Without a doubt, this is the sector to avoid at the moment.
XLF and XLI rotated into the lagging quadrant some weeks ago and continued to travel further into it at negative RRG-Headings, making them another two sectors that are better avoided in coming weeks, maybe months.
The last sector inside lagging is XLB. The (very short) tail is slightly up-sloping, but is still moving lower on the JdK RS-ratio scale. The shortness of the tail suggests a stable relative (down)trend.
Inside the improving quadrant, XLY is the sector that just rolled over and started to head back to the lagging quadrant, which it will probably enter once again soon.
XLRE and XLP are inside improving, but are traveling at a strong RRG-Heading and very close to crossing over into leading. This combination makes them two sectors to watch as potential outperformers in coming weeks. Based on the price charts, my preference would be for XLP over XLRE.
Inside the leading quadrant, XLU and XLV are rotating further into it at a strong RRG-Heading, while XLK remains stable at high JdK RS-RS-ratio levels and a steady RS-Momentum value. The short tail indicates a stable trend.
XLC is inside the leading quadrant but very close to the center of the chart, which means that the sector is likely to perform in line with the market.
Here are the links to the weekly charts mentioned above: XLE, XLF, XLI, XLB, XLY, XLRE, XLP, XLU, XLV, XLK.
Daily
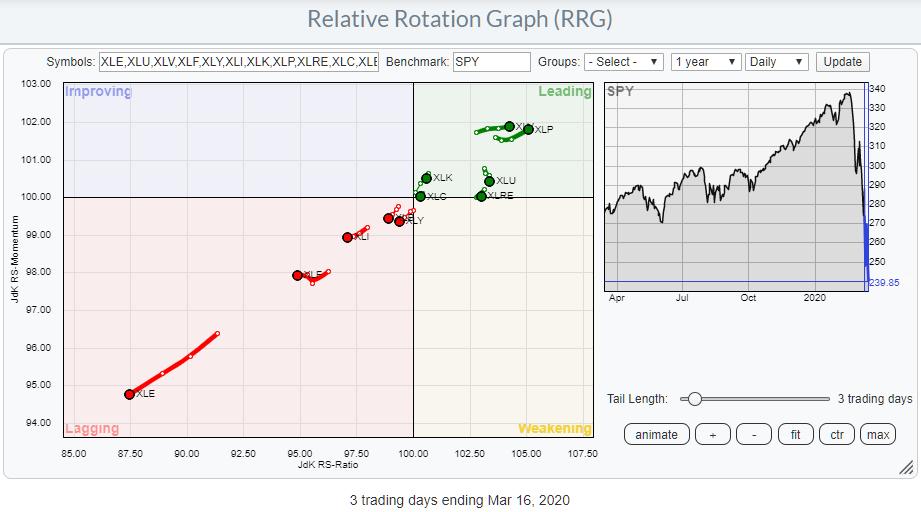
The daily RRG is even more pronounced than the weekly version, with no sectors in weakening nor in improving. Almost all sectors are on the same or similar trajectory as they are on the weekly RRG.
XLK just completed a daily rotation from leading through weakening and lagging, then straight through the center of the chart back into leading. It is now back on track and aligned with the weekly tail for RRG once again.
XLU, XLV and XLRE are well on track on the weekly RRG but are (slightly) losing momentum on the daily version. This could indicate a short pause in the improvement for these sectors and maybe a quick rotation through weakening, then back to leading.
XLC remains close to the benchmark on both time frames.
XLY is rolling over inside the improving quadrant on the weekly RRG. On the daily chart, the sector has just rotated back into lagging from weakening. With both rotations now at the same RRG-heading again, an acceleration of the relative downtrend can now materialize.
Despite the fact that markets are going down overall and we will have no idea if and when things will reverse (or at least calm down), there are still plenty of opportunities to explore. This is especially true from a relative point of view; pair trading or hedging positions, reverse ETFs, (put) options, futures are great instruments to create the exposure you want to profit from different relative trends.
Stay safe!
-- Julius
Julius de Kempenaer
Senior Technical Analyst, StockCharts.com
Creator, Relative Rotation Graphs
Founder, RRG Research
Want to stay up to date with the latest market insights from Julius?
– Follow @RRGResearch on Twitter
– Like RRG Research on Facebook
– Follow RRG Research on LinkedIn
– Subscribe to the RRG Charts blog on StockCharts
Feedback, comments or questions are welcome at Juliusdk@stockcharts.com. I cannot promise to respond to each and every message, but I will certainly read them and, where reasonably possible, use the feedback and comments or answer questions.
To discuss RRG with me on S.C.A.N., tag me using the handle Julius_RRG.
RRG, Relative Rotation Graphs, JdK RS-Ratio, and JdK RS-Momentum are registered trademarks of RRG Research.
Julius de Kempenaer
Senior Technical Analyst, StockCharts.com
Creator, Relative Rotation Graphs
Founder, RRG Research
Host of: Sector Spotlight
Please find my handles for social media channels under the Bio below.
Feedback, comments or questions are welcome at Juliusdk@stockcharts.com. I cannot promise to respond to each and every message, but I will certainly read them and, where reasonably possible, use the feedback and comments or answer questions.
To discuss RRG with me on S.C.A.N., tag me using the handle Julius_RRG.
RRG, Relative Rotation Graphs, JdK RS-Ratio, and JdK RS-Momentum are registered trademarks of RRG Research.


