What a week ....
With stock markets flying all over the place, I always find it an enlightening exercise to take a step back and put things into a broader perspective. This can be done in multiple ways, including taking a longer-term approach, looking at different segments of the market via size (market cap) indexes (as an example) or by analyzing broader asset class rotations, etc.
As the spread of the coronavirus keeps the world in its grip and seems to paralyze life and operations in more and more parts of the world, I thought it would be a good idea to see what all this mayhem means for the various international stock markets around the world.
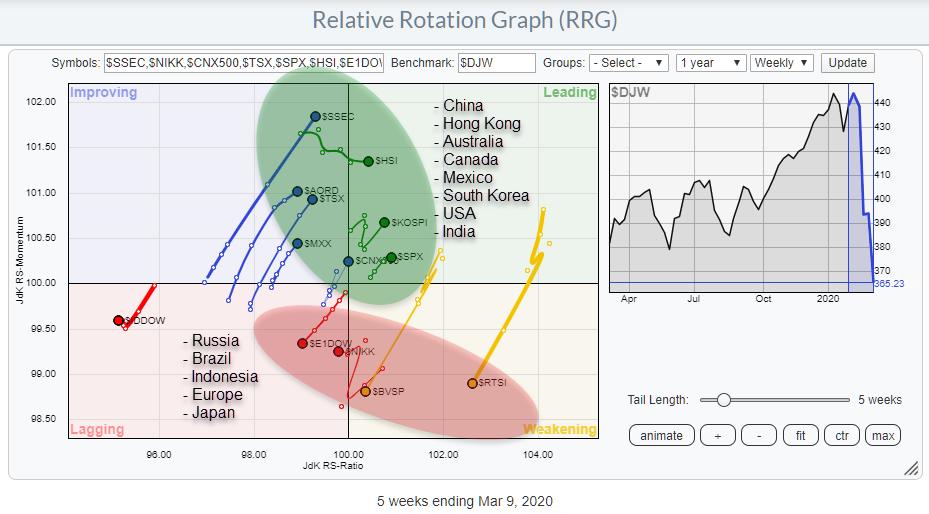
The Relative Rotation Graph above shows the rotation for some international stock market indexes against the Dow Jones Global index. This universe is available from the dropdown menu on the RRG page.
The Global (stock) Market Index
Before jumping to the rotations, I want to take a look at the chart of the benchmark itself, $DJW.
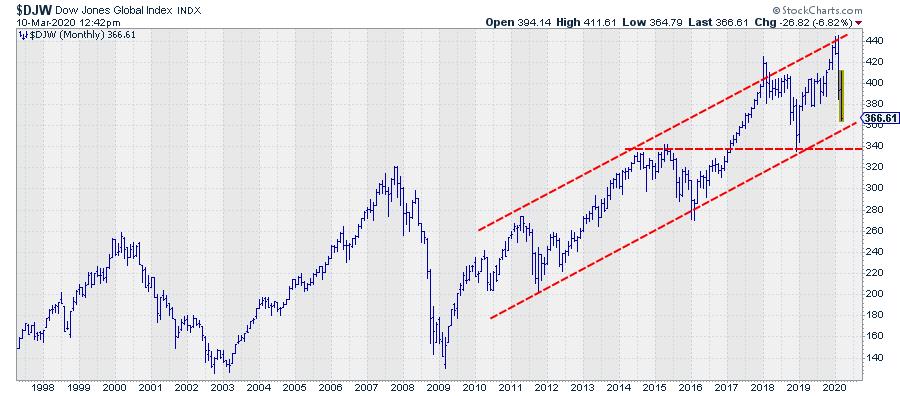
At the time of writing this article (Tuesday 3/10 midday), $DJW is still well inside the boundaries of the rising channel that has been in play since (roughly) 2010-2011. At the end of 2018, the index broke above its rising resistance line, but rapidly reversed, came back within the channel and, after a consolidation, tested the lower boundary as support. At the time, that was around the 340 level, which coincided with the peaks that were set in 2014 and 2015.
The chart is a monthly chart, so the last bar is still live, but I wanted to show the long-term picture which, so far, still seems to be holding up.
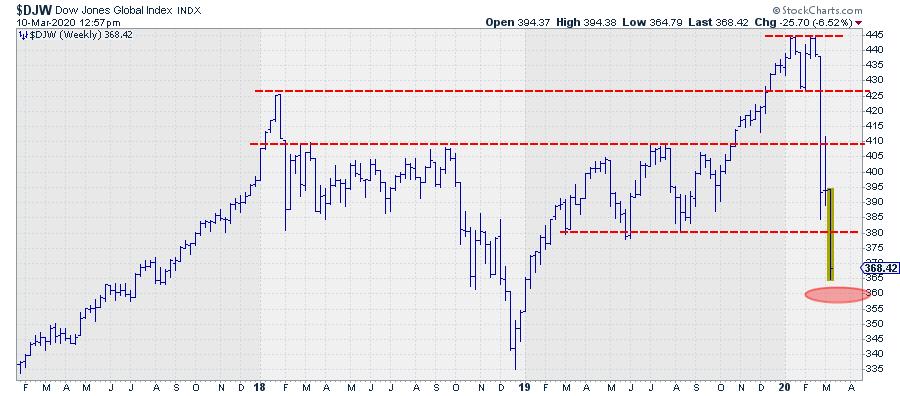
Out of that last major low, $DJW rallied to a new high in the first two months of 2020, where a clear double top was completed. That took the index back below some crucial support levels; it is now hovering just above its important rising support line, which marks the lower boundary of the trend channel.
Just to be clear, I do not think this is a buy the dip scenario and we will be back above the market horizontal levels in the near future. I expect those marked horizontal resistance levels at 380, 410, 425 and 445 to act up when we will get any rallies in coming weeks. IF we get any rallies, that is.
On the downside, risks are clearly visible. First of all, a break below the rising support line (at the end of the month) will likely break the long-term trend. It would be a negative, but, as long as the market holds above 340, it will still have the opportunity to recover.
The big level to watch for the DJ Global Index, imho, is 335-340. Breaking that level certainly changes the structure for this global stock market index.
The world is a pretty big place...
...and there are plenty of (stock) markets around the world. To get a handle on how these markets around the world move together, or in different directions from each other, you can use the Relative Rotation Graph at the top of this post. The chart shows that there are clear outperformers, but also well-defined underperformers among the markets that make up the world index.
Inside the green-shaded oval, you will find markets that are moving strongly towards or already inside the leading quadrant. These are the markets where investors are now seeking shelter from markets that are currently under (even more) pressure. These are found inside the red-shaded oval. What struck me is that the markets that started to lead the way in last weeks are predominantly Asian, with China, Hong Kong, Australia, South Korea among them.
The good news is that also the S&P 500 index is among the international leaders, with its tail inside the leading quadrant and significantly shorter that the tails of other markets. A short tail indicates a stable relative position on the RRG. More importantly, the tail of S&P 500 is at a positive RRG-Heading.
Believe it or not, this suggests that the US is an attractive market from an international perspective at the moment.
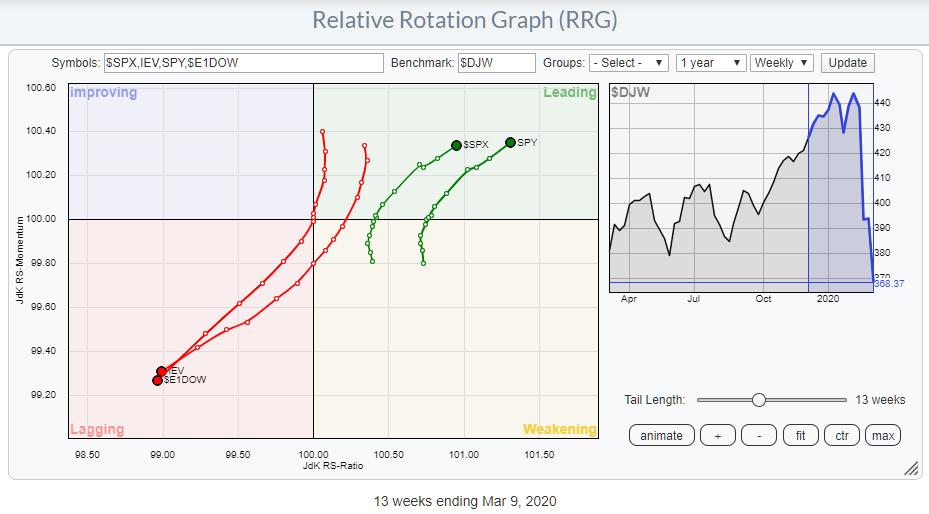
The RRG above zooms in on the rotations for $SPX and $E1DOW, the DJ Europe index. The opposite rotation could not be more clear.
I have also included SPY and IEV, ETFs that track both of the underlying indexes. This is important to know because the underlying index itself cannot be traded. You always need a "tradable instrument" to get exposure to that market.
SPY, obviously, is the weapon of choice if you would like to invest in the US stock market. IEV is the ETF that tracks the "S&P Europe 350 Index." It's not exactly the $E1DOW index used in the graph above, but good enough for our purpose, which is to create (short) exposure to European stocks.
The use of ETFs in examples like these are just to illustrate market movements and showing possible instruments that you could use to create the desired exposure. However, there are many more ways to create these exposures. Futures, options, leveraged ETFs, short ETFs, etc..
Use Europe as a hedge
With markets moving all over the place, it is very difficult to engage in directional positions. What you think will work today may not be working anymore tomorrow. Obviously, you could simply stay on the sidelines and let the market do its thing and come back when things have calmed down a bit.
If you like to remain engaged, you could use views and analyses like this to hedge a position, for example. In this case, you could have a long position in SPY and create some sort of short position/exposure in European stocks. This assumes that the US will continue to do better than Europe. When markets in general go up, the US will go up faster than Europe. When markets go down, the US will drop less than Europe. This limits the risk of a position to the difference between these two ETFs, while you are not exposed to the outright risk of a single long position.
Because IEV is quoted in US dollars, you will also be exposed to the EUR/USD exchange rate.
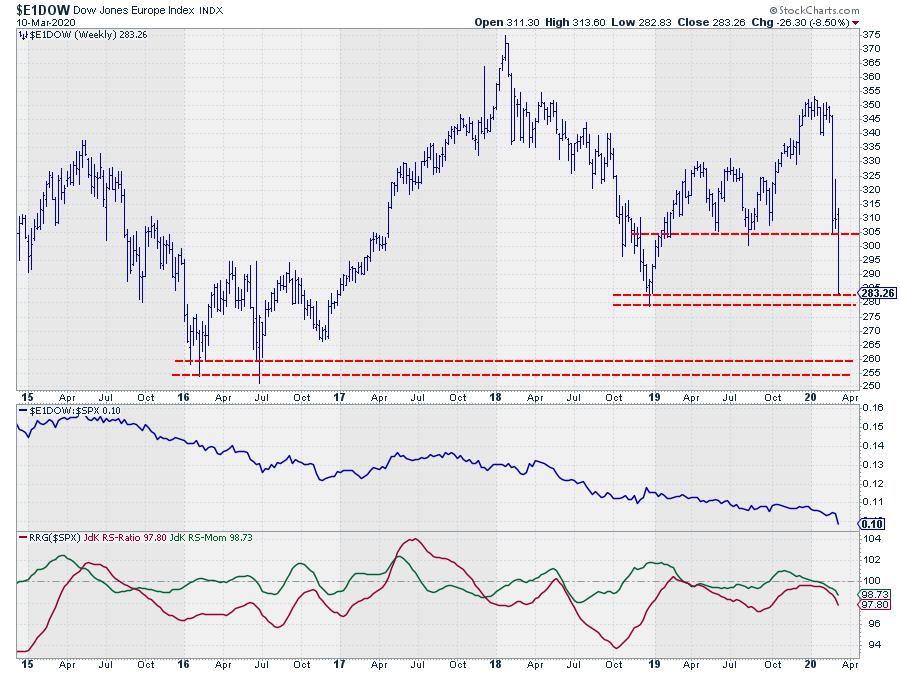
Looking at the price chart of the underlying index ($E1DOW) with relative strength against $SPX shows that the market is now resting at support just above 280. A break below that level will very likely ignite a further down move towards levels going back to early 2016.
The raw RS-Line is still in a very solid downtrend and just started to accelerate lower once again. This acceleration is now picked up by the RRG-Lines, with both the JdK RS-Ratio and JdK RS-Momentum lines well below 100.
Stay safe, both in markets and health-wise!!
--Julius
Julius de Kempenaer
Senior Technical Analyst, StockCharts.com
Creator, Relative Rotation Graphs
Founder, RRG Research
Want to stay up to date with the latest market insights from Julius?
– Follow @RRGResearch on Twitter
– Like RRG Research on Facebook
– Follow RRG Research on LinkedIn
– Subscribe to the RRG Charts blog on StockCharts
Feedback, comments or questions are welcome at Juliusdk@stockcharts.com. I cannot promise to respond to each and every message, but I will certainly read them and, where reasonably possible, use the feedback and comments or answer questions.
To discuss RRG with me on S.C.A.N., tag me using the handle Julius_RRG.
RRG, Relative Rotation Graphs, JdK RS-Ratio, and JdK RS-Momentum are registered trademarks of RRG Research.
Julius de Kempenaer
Senior Technical Analyst, StockCharts.com
Creator, Relative Rotation Graphs
Founder, RRG Research
Host of: Sector Spotlight
Please find my handles for social media channels under the Bio below.
Feedback, comments or questions are welcome at Juliusdk@stockcharts.com. I cannot promise to respond to each and every message, but I will certainly read them and, where reasonably possible, use the feedback and comments or answer questions.
To discuss RRG with me on S.C.A.N., tag me using the handle Julius_RRG.
RRG, Relative Rotation Graphs, JdK RS-Ratio, and JdK RS-Momentum are registered trademarks of RRG Research.


