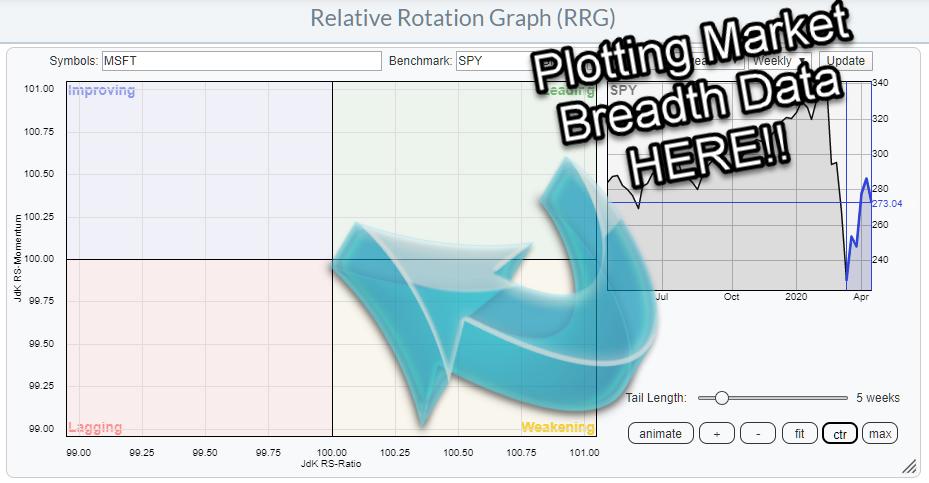
In the 4/14/20 episode of my show Sector Spotlight, which airs every Tuesday at 10:30am ET on StockCharts TV, I talked about plotting breadth data on a Relative Rotation Graph.
The link below starts at that segment.
In this article, I will add another option to take a look at sector rotation from an RRG perspective.
% stocks above a moving average
The percentage of stocks trading above a moving average is often used to measure market breath. It shows how big, or small, the participation in a rally or a decline is across the board.
On StockCharts.com there are three "universes" of such breadth measures. One set measures the percentage of stocks above their 200-day EMA, one looks at the 50-day EMA and a third one looks at the percentage of stocks above their 20-day EMA. These metrics are available for all 11 sectors in the S&P 500. These datasets can also be plotted on a relative rotation graph, which gives the advantage of being able to see the relative movement of these metrics against each other over time and provides a different angle as opposed to looking at price-based RRGs.
The fact that datasets for three different periods are available gives us the opportunity to investigate short- (20-day), medium- (50-day) and long-term (200-day) trends.
All Sectors, One Metric.
One way is to simply load up the universe for one group, say, for the 200-day EMA, and look at the universe through that lens.
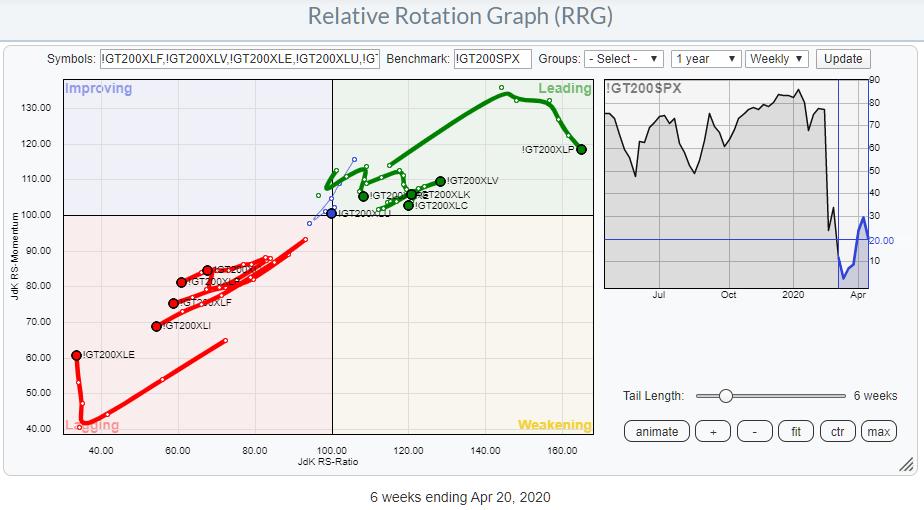
This is the up-to-date RRG showing the number of stocks above their 200-day EMA per sector. The benchmark is that same metric, but for the entire universe (S&P 500).
The clear split is pretty obvious. The sectors inside the leading quadrant (XLP, XLV, XLK, XLC, XLRE) are out-performing the sectors inside the lagging quadrant (XLE, XLI, XLF, XLB, XLY) while XLC is pretty much right in the middle together with !GT200SPOX.
"Outperforming," in this context, means that either the increase in % of stocks above their 200-day EMA is growing faster that the % of stocks above their 200-day EMA in the S&P 500 - or that they decline less fast than in the entire universe.
Just like with a normal price-based RRG, a sector can show up inside the leading quadrant while the metric is going down!!
The "price" (in the table below the chart), in this case, is the actual percentage of stocks above their 200-day EMA. If you click on the image, a live version of the chart will open on the site and you will be able to see that, currently, 45.45% of Consumer Staples stocks are above their 200-day EMA, while only 3.57% of the Materials stocks are above their 200-day EMA.
A quick conclusion could be that, from this point of view, traditionally defensive sectors are doing a lot better than their offensive counterparts. However, the increases in XLP, XLK, XLC, and XLRE are rolling over and starting to lose momentum while the increase in XLV is still continuing higher.
Three Timeframes, One Sector
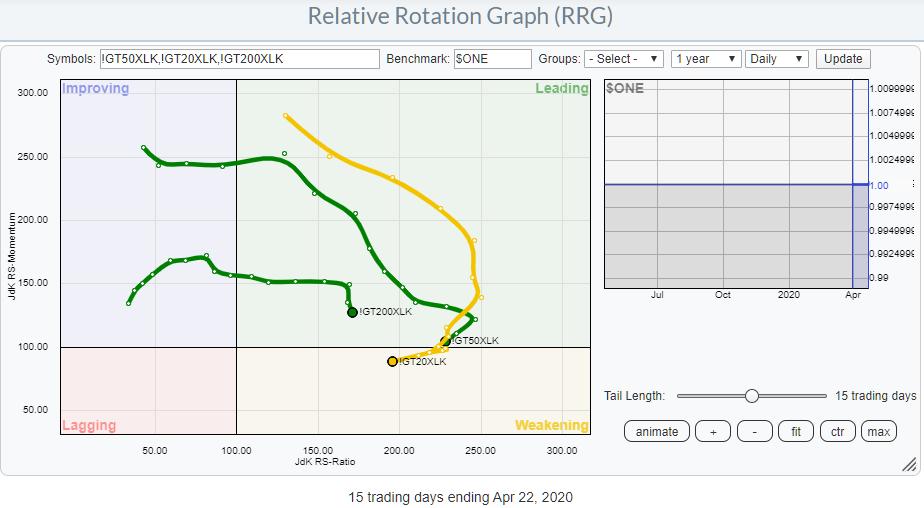
Another approach is to plot the data-sets for all three timeframes, i.e. the 200-, 50-, and 20-day EMAs, on one RRG. In this case, imho, it is best to use $ONE as the benchmark. This is because we are now looking at three different metrics of one security. As a matter of fact, the real reference point here is the movement among the three metrics; the position vs. the benchmark/center of the chart is of less importance.
Btw, I am using a daily RRG above to show the interaction of these three metrics, but it can be used equally well on a weekly version. Just be aware that, because of the general decline in the market and its breadth, all tails are clustering inside the weekly quadrant. The daily chart above shows a bit more detail on development of breadth during the recent upward bounce.
In the first example, one metric for all sectors, we need a common denominator to better see the differences. In this case, $ONE serves our purpose just fine. Of course, you can play around with other settings and benchmarks. As a matter of fact, I encourage everybody to do that and find a setup that works for you individually.
This approach shows that the three different values for one sector can give you (early) warning signals when the short-term breadth starts to roll over and you will be able to get confirmation (or negation) from the the medium- and long-term values.
As you can see in the RRG above, short-term breadth (20-day) has started to roll over and has actually already entered the weakening quadrant. It is now moving lower on the RS-Ratio axis. Medium term (50-day) rolled over sharply two weeks ago and long-term (200-day) so far just lost momentum.
At the minimum, this shift in breadth for the Technology sector should be taken as a warning sign.
Bullish % per sector
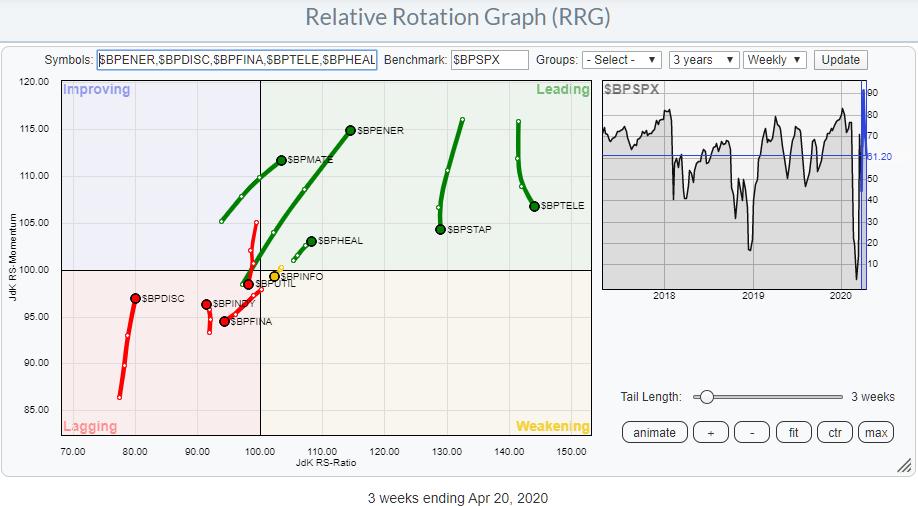
Another breadth metric that is available on StockCharts.com on a per sector basis is Bullish Percent. This universe is shown on the RRG above (weekly data) using the BP for the S&P as a whole as the benchmark. Just like the breadth data using % stocks above their EMA, this one also shows you the relative moves of the BP numbers per sector vis-a-vis each other.
One tail that immediately attracts my attention is the one for the Energy sector. It is well inside the leading quadrant, traveling at a positive RRG-Heading and, given the length of the tail in comparison with the other sectors, is picking up that pace much faster than the rest.
Given the position of XLE on the price-based RRG for US sectors, this discrepancy makes me very curious... At least it raises the question:
Is the Energy sector starting to show some underlying improvements, at least on a relative basis, that is not visible in its price yet?
Definitely food for thought.
I hope this article, in combination with the segment in Sector Spotlight, helps you to get an idea on how you can use market breadth, but also other non price related data-sets, in combination with Relative Rotation Graphs to look at markets/sectors from a different angle and get some out-of-the-box and away-from-mainstream ideas.
#StaySafe and, as usual, I love to hear your feedback!
--Julius
Julius de Kempenaer
Senior Technical Analyst, StockCharts.com
Creator, Relative Rotation Graphs
Founder, RRG Research
Host of: Sector Spotlight
Please find my handles for social media channels under the Bio below.
Feedback, comments or questions are welcome at Juliusdk@stockcharts.com. I cannot promise to respond to each and every message, but I will certainly read them and, where reasonably possible, use the feedback and comments or answer questions.
To discuss RRG with me on S.C.A.N., tag me using the handle Julius_RRG.
RRG, Relative Rotation Graphs, JdK RS-Ratio, and JdK RS-Momentum are registered trademarks of RRG Research.


