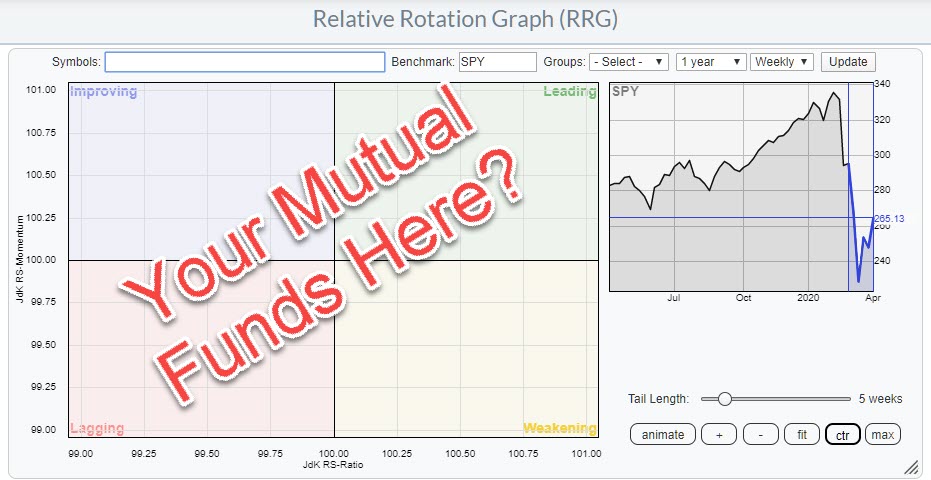
Recently I received a message asking if Relative Rotation Graphs would be useful for tracking Mutual Funds. My answer: Of course they are!
Pricing of Mutual Funds
In essence, the prices of mutual funds are also the result of people buying and selling on financial (stock) markets. The difference between a mutual fund and a stock or ETF is that it is more an indirect result.
When we study price charts of ETFs and stocks, we look at the result of all the combined buying and selling that has taken place in the market over time.
A mutual fund is run by a portfolio manager of fund manager who decides which stocks to buy and sell for the fund. The value of the fund is the total value of the fund divided by the number of outstanding shares.
Investors buying or selling the fund itself will not impact the price of the fund because, when investors want to buy the fund, the fund management company will issue more shares/participations in the fund and add the incoming money to the portfolio. When people are selling their holdings in the fund, the fund management company will redeem the number of outstanding shares in the fund and, if necessary to raise cash, sell some of its holdings to pay the investor that sold shares in the fund.
All in all, this process of issuing and redeeming shares in the fund will not impact the price/value of the fund.
(No) Impact on Price of the Mutual Fund
Clearly, the price changes in the stocks that are inside the portfolio WILL impact the price of the fund. So, whereas the buying and selling of the fund by investors will not directly impact the price of the fund, this buying and selling automatically causes the fund to buy and sell stocks in the portfolio, which WILL cause supply and demand for stocks.
So, fund investors are also, albeit indirectly, responsible for supply and demand in individual stocks. This means that the resulting price of the mutual fund can be used in all our technical graphs, just like we do for individual stocks and ETFs, etc.
Therefore we can also definitely use Relative Rotation Graphs to show the relative movement versus a benchmark for mutual funds.
There are many ways we can do that, but here is one that you may want to implement in your own account.
Use ChartLists and RRG to Monitor your Mutual Fund Portfolio
If you are an investor who only invests in mutual funds, or you have a separated mutual fund portfolio, you can set up a chartlist that holds the funds in your portfolio so you can track the price development of these funds on your charts. By the way, that is a great way to use chartlists in and of itself.
But nothing will stop you from using the function "View List As" on you chart list.
I have set up a chart list for an imaginary portfolio in my account. The list is called "JdK Portfolio sample".
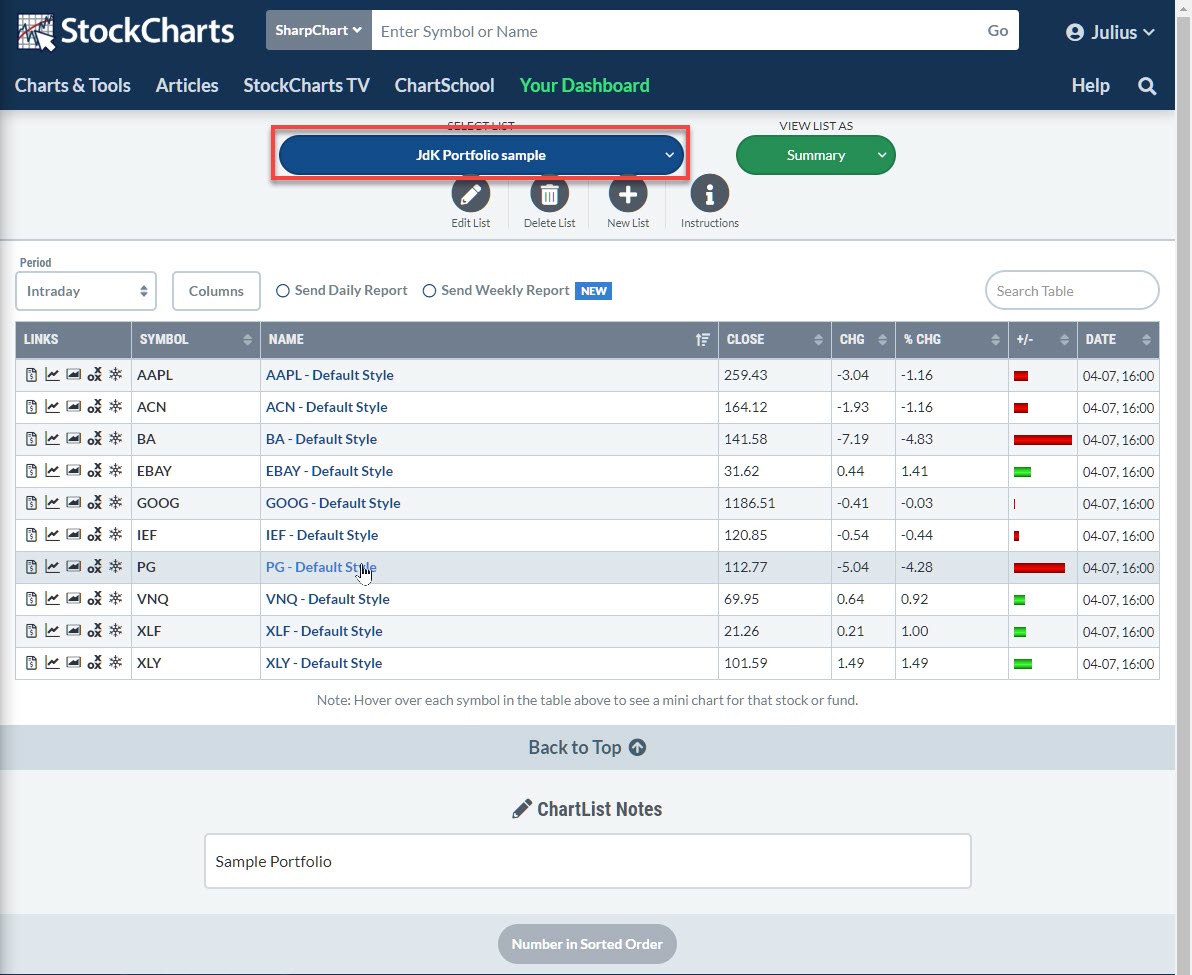
The image above shows you the default view (summary) for that chartlist.
The "secret" is hidden under the green button, which turns blue when you hover your mouse over it.
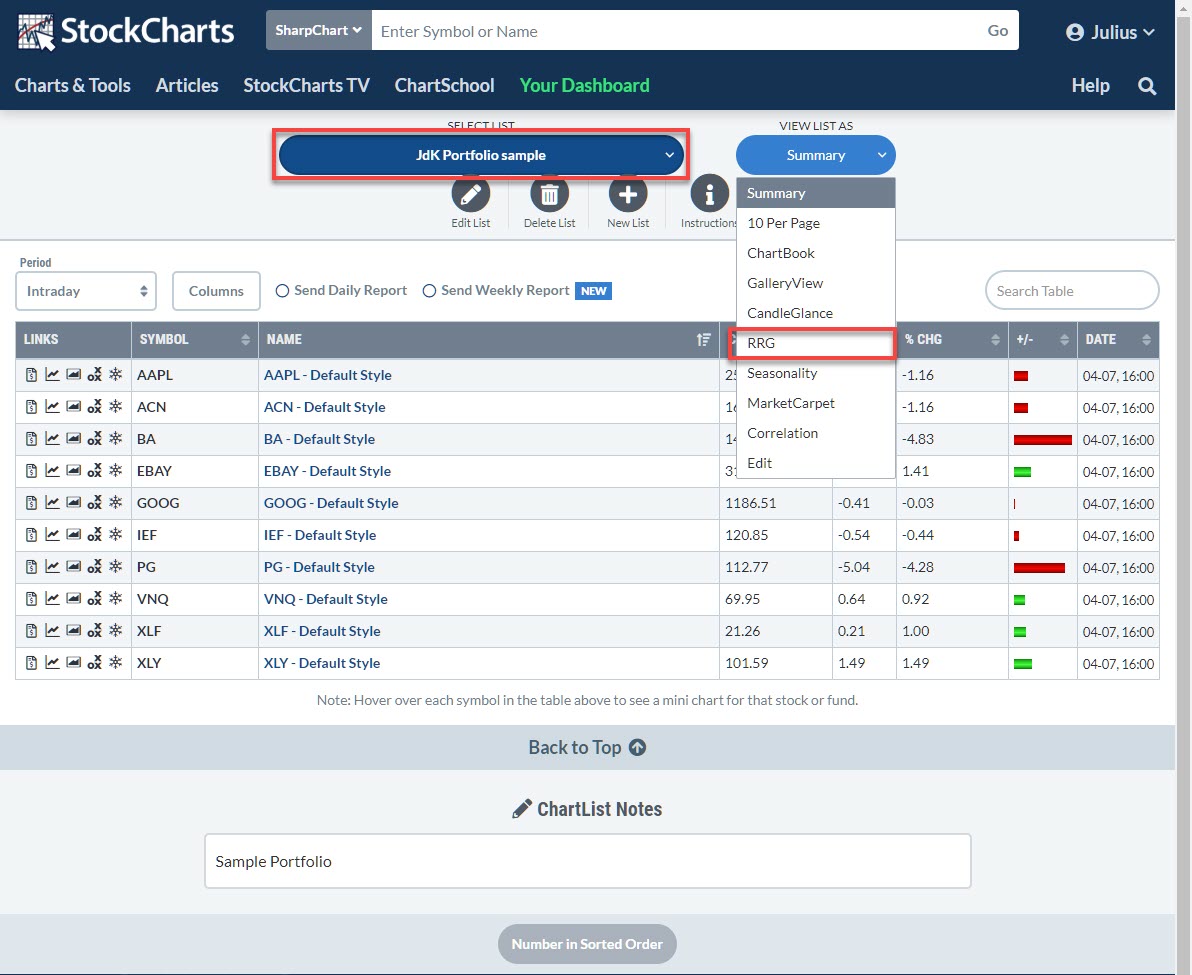
Opening the list of options under "View List As" shows a variety of ways to show the symbols on the chart list. One of these options is RRG.
When you select the RRG option, your chartlist will be loaded into an RRG, with $SPX as the default benchmark.
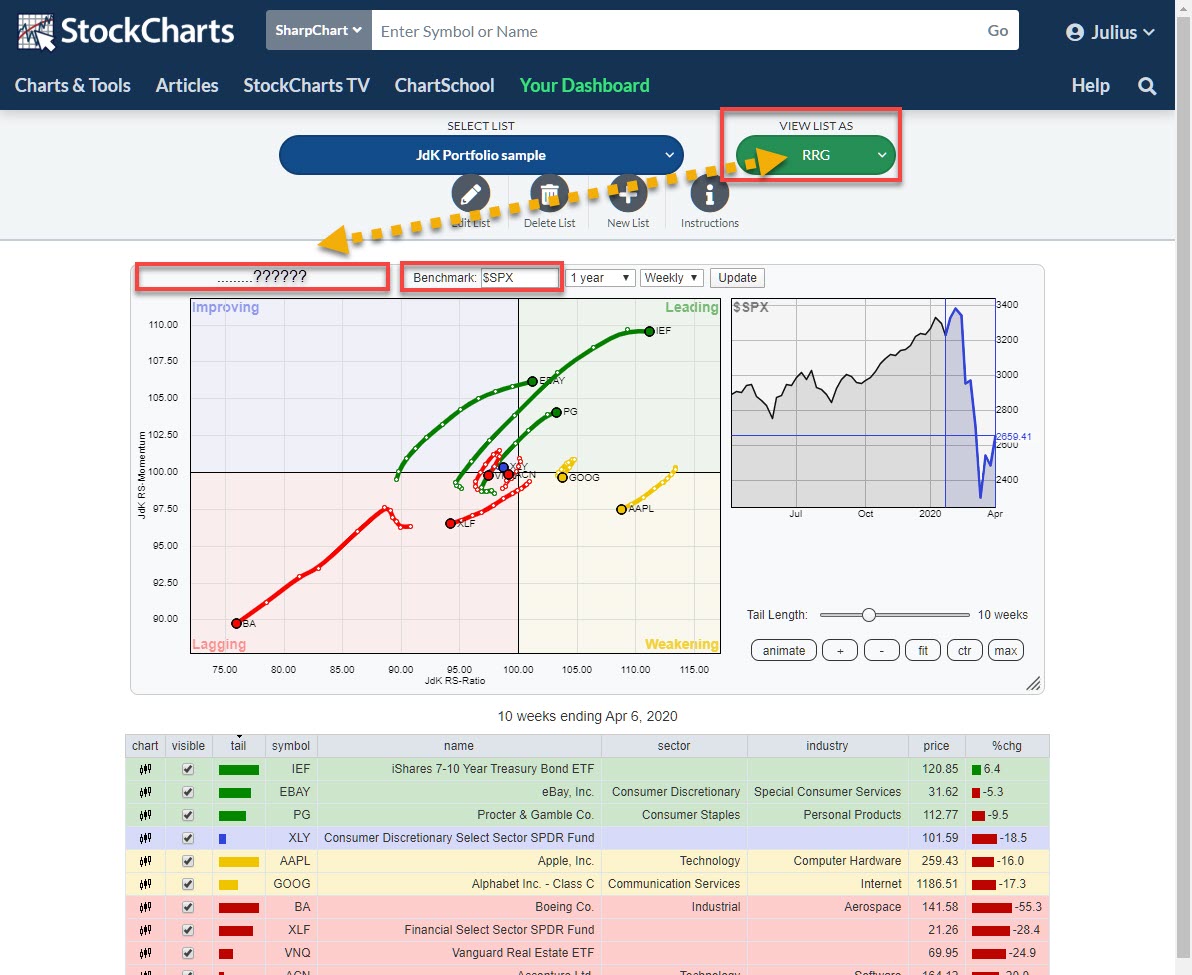
You can still change the benchmark to anything you like, but, as you can see in the screenshot above, you cannot change the symbols that are displayed. That is because this RRG is linked to your chartlist.
The benefit is that you do not need to change your RRG every time the composition of your portfolio/chartlist changes. Just simply select "View List As" - RRG and voila, your entire portfolio in an RRG.
Just make sure you select the proper benchmark. If your portfolio of mutual funds only holds funds that invest in stocks, the S&P will do just fine. But when you have a more asset allocation-type portfolio, you may want to choose a benchmark that better represents that investment approach. I always use VBINX for that purpose.
If you have a mutual fund portfolio to invest in foreign stock markets, you may, for example, want to use a more internationally-oriented benchmark like $DJW, etc.
I also addressed this question in the Sector Spotlight episode that was aired last Tuesday (4/7).
Sector Spotlight #25 (4/7/2020)
#StaySafe
--Julius
Julius de Kempenaer
Senior Technical Analyst, StockCharts.com
Creator, Relative Rotation Graphs
Founder, RRG Research
Host of: Sector Spotlight
Please find my handles for social media channels under the Bio below.
Feedback, comments or questions are welcome at Juliusdk@stockcharts.com. I cannot promise to respond to each and every message, but I will certainly read them and, where reasonably possible, use the feedback and comments or answer questions.
To discuss RRG with me on S.C.A.N., tag me using the handle Julius_RRG.
RRG, Relative Rotation Graphs, JdK RS-Ratio, and JdK RS-Momentum are registered trademarks of RRG Research.


