This article appeared in the Chartwatchers newsletter last weekend (5/9) but as it touches on one of the core interpretation basics for Relative Rotation Graphs I wanted to have it in the RRG-blog as well. So in case you missed this weekend's newsletter, here is your second chance ;)
Sometimes it is unclear how daily and weekly RRGs align with each other.
Just to be clear, this is not the same as the difference between daily and weekly RRGs. With regard to that difference, there is a ChartSchool article that explains it in detail.
What we are talking about here is how daily and weekly RRGs are updated with new prices and how they align.
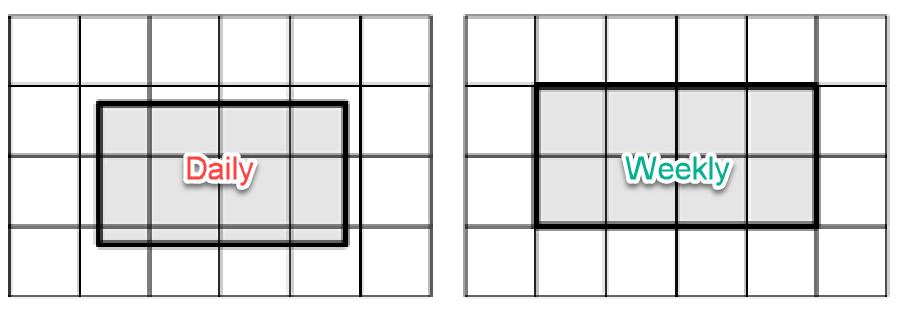
Daily
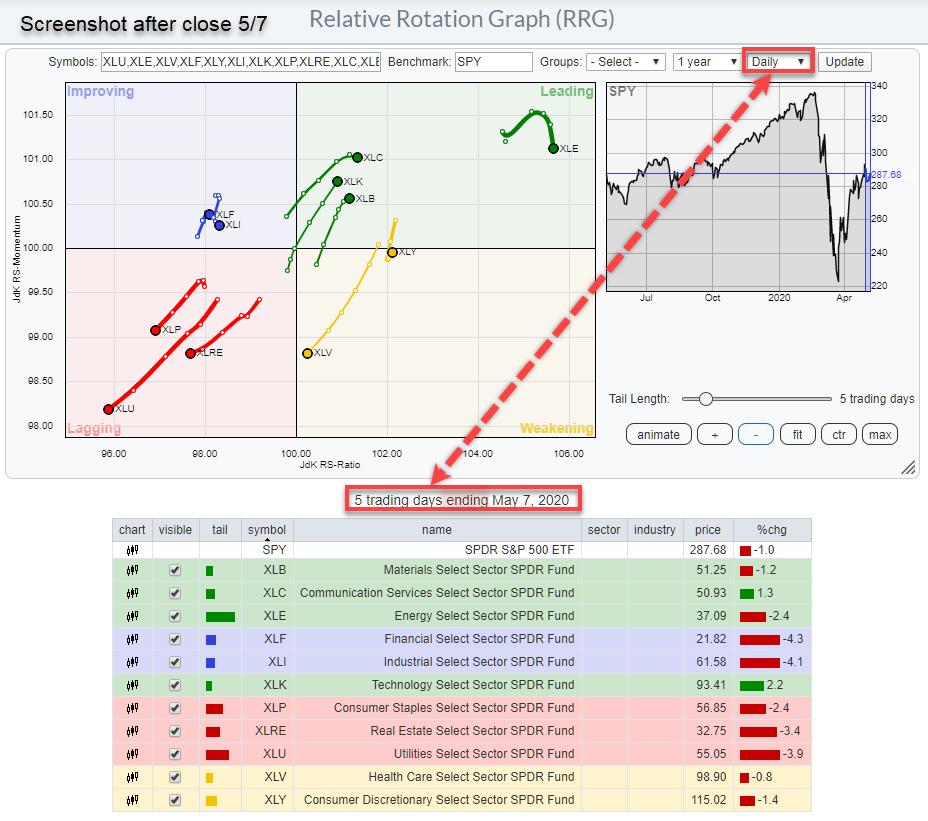
The chart above shows a daily RRG with a five-period (in this case days) tail. The label below the chart indicates that the chart shows "5 trading days ending May 7, 2020". The "5 trading days" refers to the length of the tail. If we slid the tail-length to 10 trading days, the label would say "10 trading days ending May 7, 2020". "Ending May 7" means that the chart is using the last price from May 7.
So far, this is all pretty straightforward. But switching to the weekly RRG can potentially cause some confusion.
Weekly
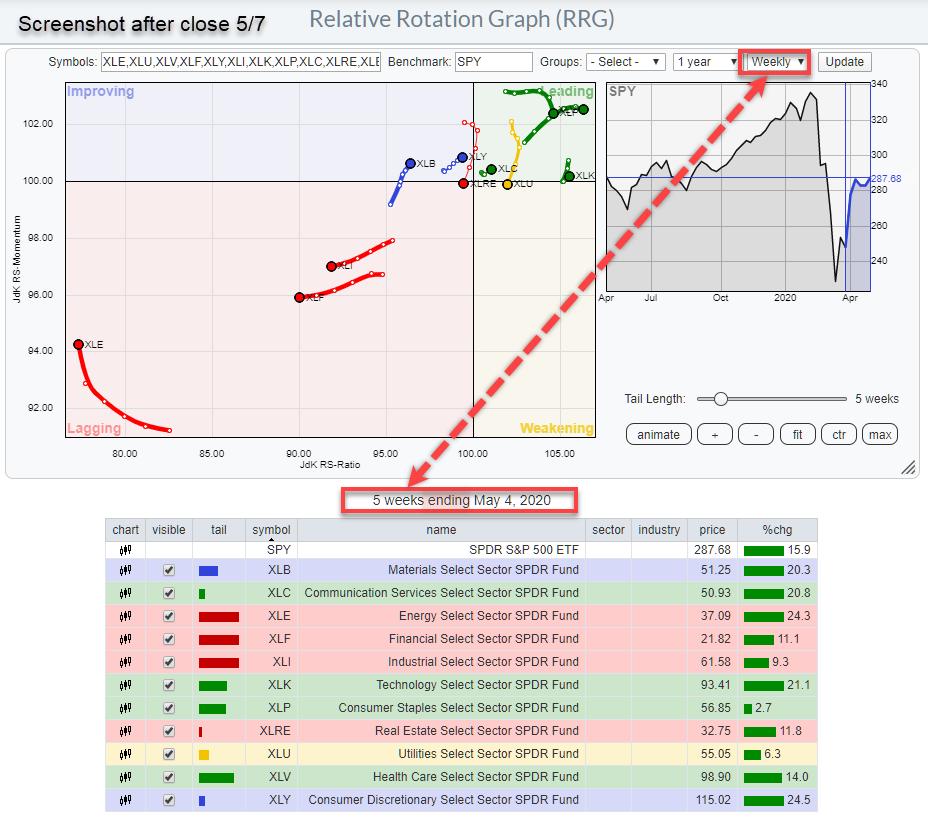
On the weekly version of the chart (screenshot snapped at the same time as the daily chart above), we see a similar annotation, but with a subtle, potentially confusing, difference. You can double-check the moment of comparison by looking at the prices in the table below the chart. As you can see, they are identical!
Similar to the daily chart, we have a label reading "5 weeks ending May 4, 2020". The "5 weeks" part is again referring to the length of the tail. Instead of 5 days, the tail is now 5 weeks. That difference shows in the differences between the %chg number in the tables below both charts.
The "ENDING May 4, 2020" part of the label is where confusion can arise.
The screenshot was snapped on May 7, after the close. So why does the label say "May 4"? This has to do with the way StockCharts.com is date/time-stamping bars on charts.
For daily charts, that is pretty obvious - it is the day in question. But when you move to weekly or monthly bars and also to intraday bars (hourly, 10 mins, etc) you have to make a choice. Are you using the date/time stamp at the end of the bar, when the bar has completed, or are you using the date/time stamp at the beginning of the bar, when the bar starts?
The convention at StockCharts is to stamp the bar at the beginning of the period. So, for weekly charts, that means that a bar for the week stat starts May 4 and ends May 8, will be stamped as May-4, even when the actual day is already May-7.
Monthly bars for example are all stamped at the first trading-day of the month.
Hence when you want to indicate that that week is the last week in your observations, like in the label below the RRG, the tail is ending with the week that is beginning May-4.
As said, it may be a bit confusing in the beginning, but when you keep in mind that all these dates are referring to the BEGINNING of a period, it all makes sense!!
What About (Real-Time) Updating?
Now that we know how to look at and read the date-time stamping on the Relative Rotation Graph, what about updating when new prices are coming in?
RRGs are static, so they are not automatically refreshed when new data/prices become available. However, when you refresh an RRG (just click update in the top-right corner), the latest prices will be used and the end-points on the tails will updated accordingly. This means that RRGs will always use the latest available price to update the chart when it is rendered. You can check this for yourself by just clicking the "Update" button during the trading day and checking the prices in the table below the chart.
Daily
Here is a screenshot of the daily RRG on Friday May-8, 20 minutes after the open.
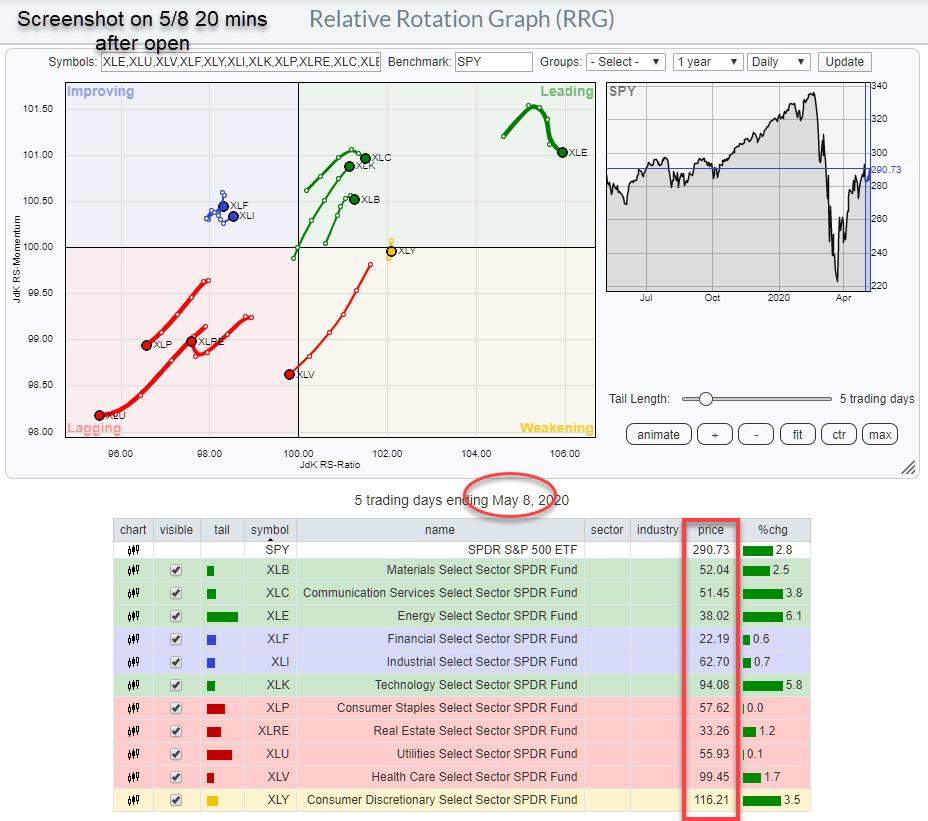
The prices in the table are now the prices from May-8 at the time of the screenshot.
When you compare this chart to the Daily RRG at the top of the article, with the screenshot taken after the close, you can see that the tails now have shifted forward one node, as a new trading day has started. This is best visible on the tail of XLV, as it has now just crossed over from the weakening quadrant into the lagging quadrant.
The next screenshot was taken 30 minutes after the open on May-8.

The prices are now updated to the new time. The endpoints of the tails have also been updated with the new prices, but this is hardly visible because there is only a minimal difference.
This process will continue during the day until the close. Then, at the open of the next trading day, the tail will shift forward one node and it all starts over again. So remember that the last node on the tail is fluid until that period, in this case a day, closes.
Weekly
On the weekly RRG, a similar thing will happen. Whenever you call a weekly RRG, the latest prices will be used to draw the RRG. The only difference is that the nodes on the tail will only shift one period forward at the start of the new week. The last node on the tail remains fluid the whole week, right up until that week closes after Friday's trading.
The chart below shows the weekly RRG for May-8, saved 90 minutes after the open.
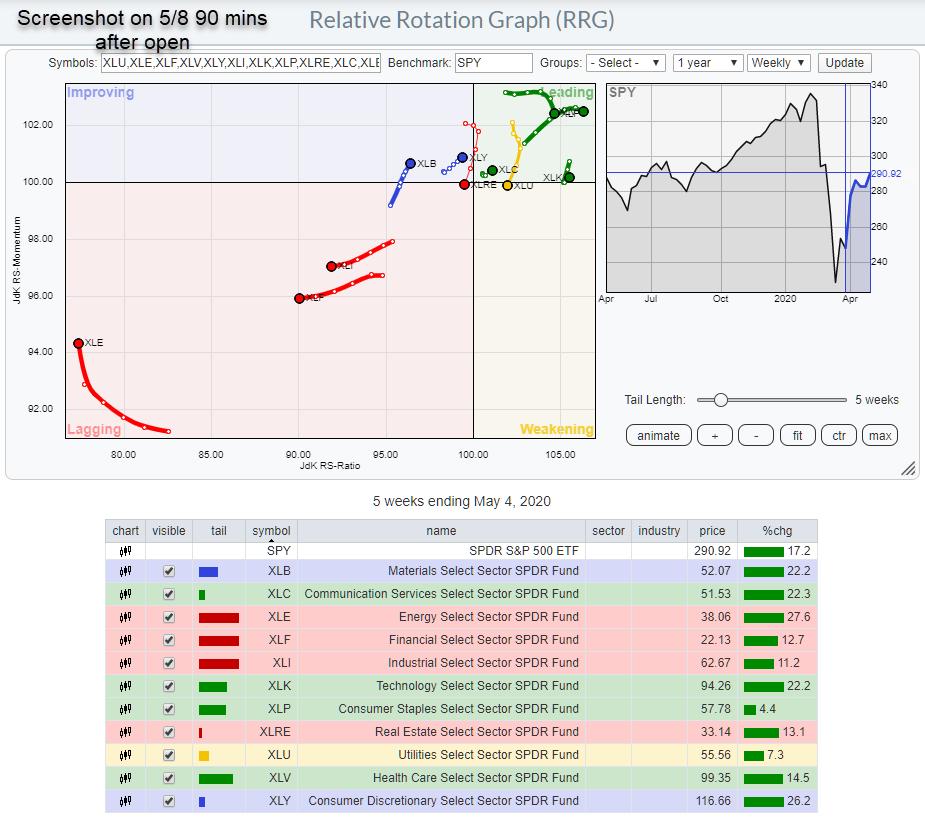
You can see the change in prices compared to the screenshot after the May-7 close, which is printed higher up in this article. The nodes prior to the last one on the tail are still in the same place, just like where they were on the first screenshot. The last nodes, the endpoint of the tails, have moved, albeit only a little.
The best visible move, I think, is seen on the tail of XLE in the lower left corner, where the last node is now clearly away from the 94 mark on the RS-momentum scale while it was still touching that grid line on the previous screenshot. When this week's closing prices are in, that last node will be fixed. And then, when the market opens again next Monday, the tail will shift forward one period and the updating through the week starts all over again.
I hope this clarified some possible confusions or questions you may have had, even when you did not realize you had them. ;)
Please let me know what you think or when things still remain unclear. Also, I discussed these items in last week's Sector Spotlight show, which you can review here (video starts at the specific segment):
Seasonality and Sector Rotation in US Stocks | Julius de Kempenaer | Sector Spotlight (05.05.20)
#StaySafe, Julius
Julius de Kempenaer
Senior Technical Analyst, StockCharts.com
Creator, Relative Rotation Graphs
Founder, RRG Research
Host of: Sector Spotlight
Please find my handles for social media channels under the Bio below.
Feedback, comments or questions are welcome at Juliusdk@stockcharts.com. I cannot promise to respond to each and every message, but I will certainly read them and, where reasonably possible, use the feedback and comments or answer questions.
To discuss RRG with me on S.C.A.N., tag me using the handle Julius_RRG.
RRG, Relative Rotation Graphs, JdK RS-Ratio, and JdK RS-Momentum are registered trademarks of RRG Research.


