In my weekly Sector Spotlight show on StockCharts TV, I present a segment on pair-trading ideas from time to time. This initially started out as 1-1 pair trades ideas, later changing to a basket of long ideas vs. a basket of short ideas.
In the episode that I recorded yesterday (6/15) which aired today (6/16 10.30am ET) and is now available on the StockCharts YouTube channel, I did not have enough time to cover these baskets, so here are some new additions that I will elaborate on here in this article.
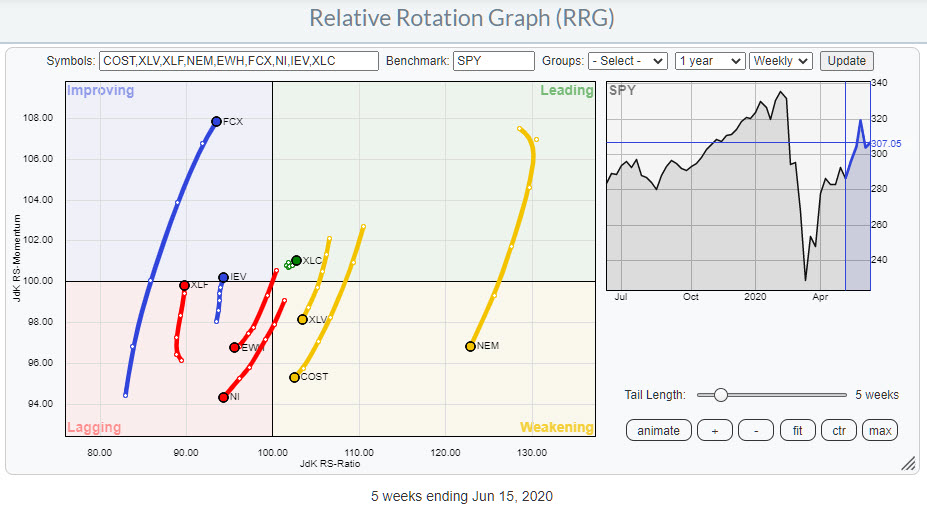
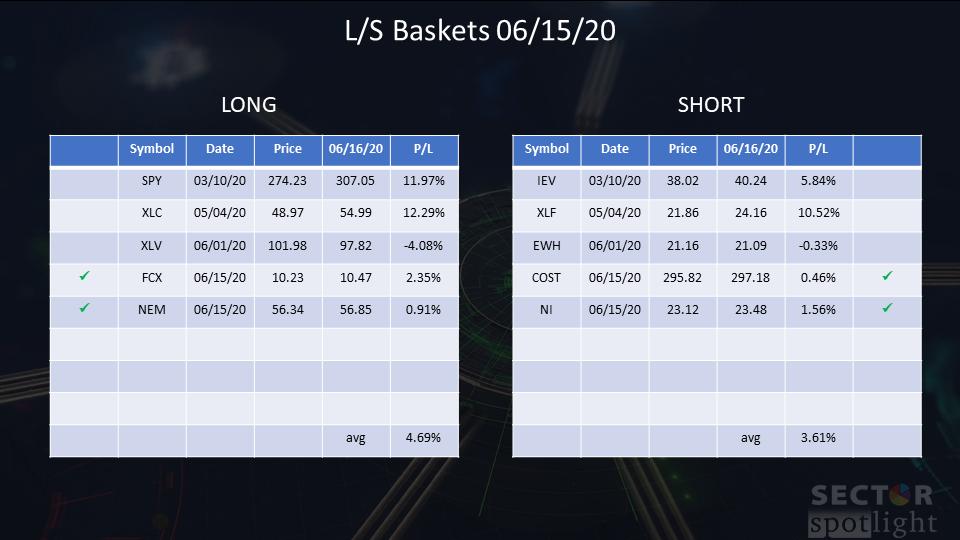
The last time I updated these baskets, I ended with three long ideas (SPY, XLC, and XLV) and three short ideas (IEV, XLF, and EWH).
Last week, I hosted Your Daily Five on Thursday (6/11) and was a panelist in The Pitch on Friday (6/12). In both shows, I looked at some individual stocks both from the long as well as the short side.
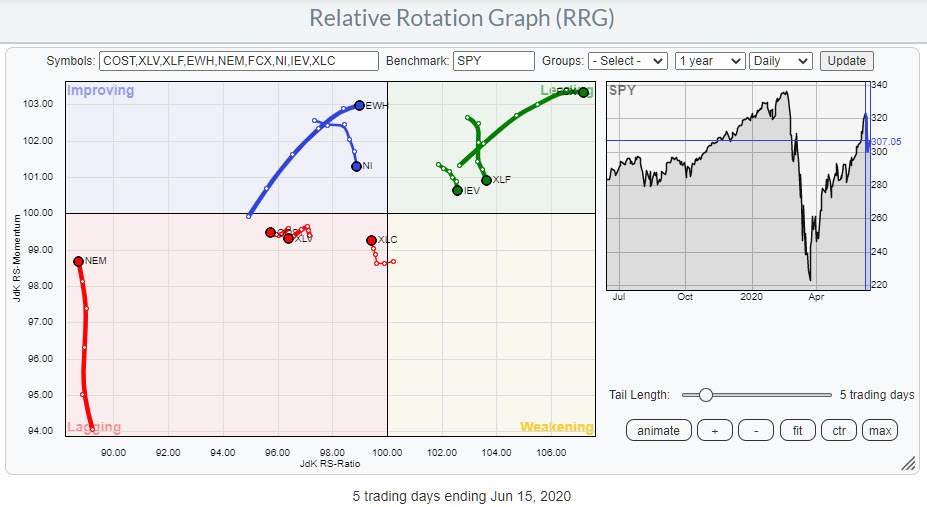
The RRG at the top of the article shows all stocks and ETFs that are currently in the basket, including the new additions. The RRG below shows the same universe on a daily timeframe.
I am adding two longs and two shorts to my baskets. On the short side, those are COST and NI, while on the Long side, we have FCX and NEM.
Just to be sure: All these observations are for educational purposes only, showing how Relative Rotation Graphs® can be used to select sectors and stocks for both long and short positions. Nothing should be seen as a recommendation or advice to buy or sell.
COST - Costco Wholesale Corp.
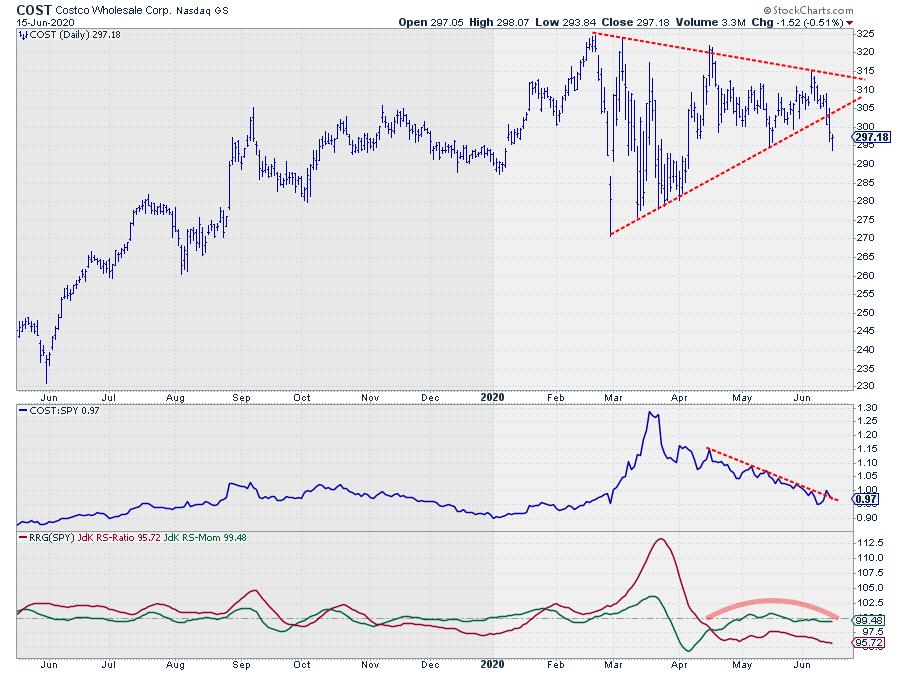
COST is a member of the Consumer Staples sector, which is currently rotating at a negative RRG-Heading and has just entered the lagging quadrant on the weekly RRG. Within the Staples sector, COST itself is also rotating at a negative RRG-Heading against XLP and inside the weakening quadrant. On the daily RRG for the staples sector, COST is well inside the lagging quadrant and continuing to lose relative strength.
The RRGs in this article have SPY as the benchmark and, therefore, position COST slightly differently, but still at a negative heading and in a relative downtrend.
The price chart confirms the relative weakness, as COST just broke out of a large consolidation triangle in a downward direction as RS-Line vs SPY put in a new lower high, confirming the existing relative downtrend. This can also be seen in the RRG-Lines, where the JdK RS-Momentum line is crossing back below 100, pushing the daily tail further into the lagging quadrant.
All in all, that's enough reason to approach this stock from the short side.
NI - Nisource Inc.
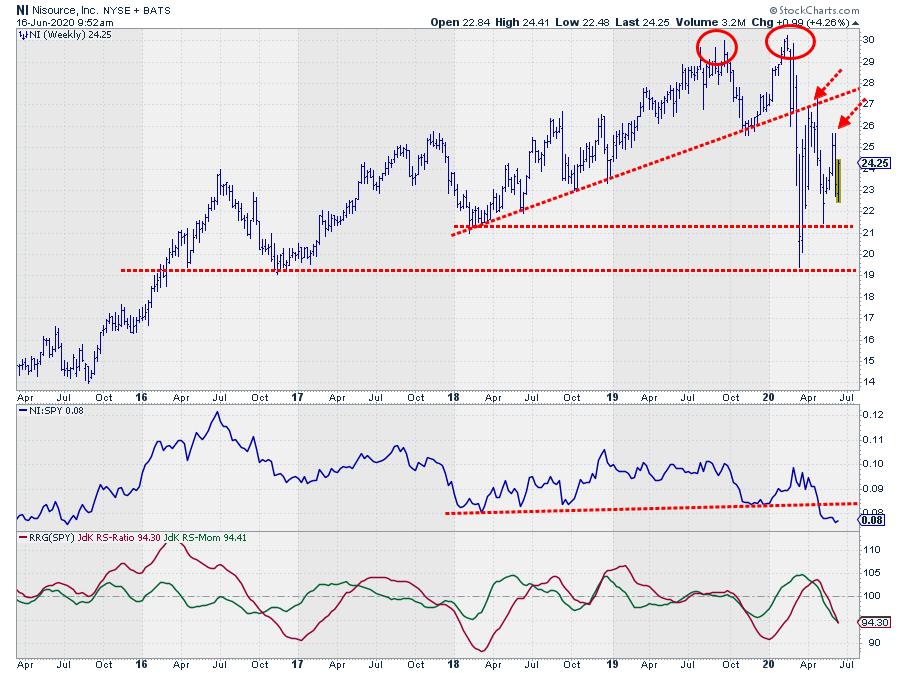
NI is part of the Utilities sector, which recently rotated into the lagging quadrant on the weekly RRG. The stock itself rotated into lagging against XLU a few weeks ago and is now traveling at a negative RRG heading further into the lagging quadrant.
In the RRGs above against SPY, you will find NI well inside lagging on the weekly timeframe and rolling over inside improving on the daily timeframe. The weekly price chart, in combination with relative strength, is confirming this weakness. Price broke below an important rising support line and has now already formed two lower highs after the February peak.
The break lower in relative strength is very convincing and is pushing the RRG-Lines sharply lower. With limited upward potential and increasing downward risk, I prefer to approach NI from the short side.
NEM - Newmont Corporation
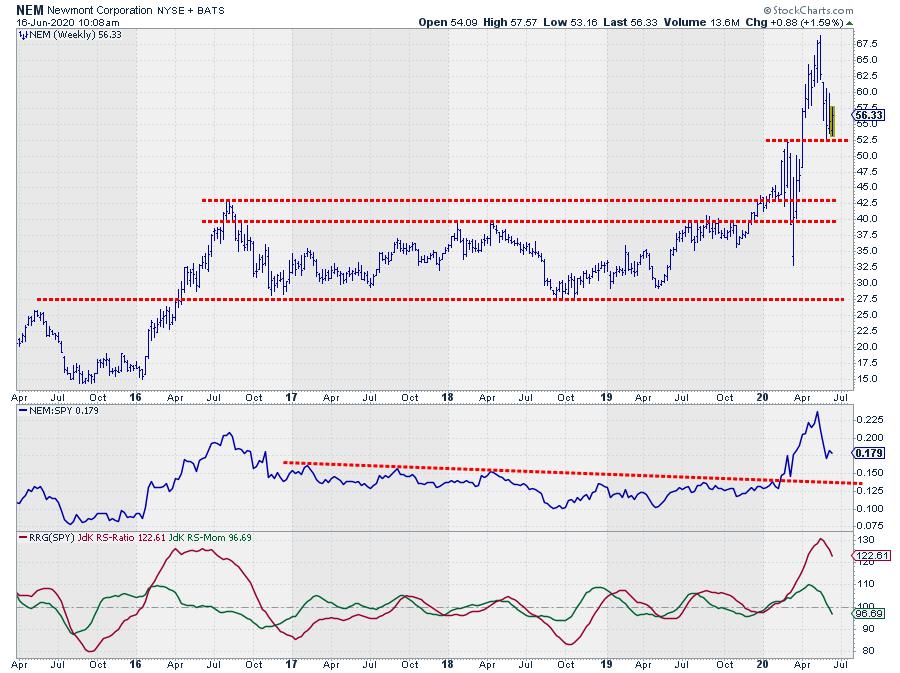
The materials sector showed a strong rotation during the past few weeks. NEM has been one of the big drivers for this improvement. When you run the RRG for all members vs. XLB, you will find NEM far away to the right and inside the weakening quadrant (see the high RS-Ratio level and the RS-Momentum line just below 100). The daily RRG is inside the lagging quadrant but is rising almost vertically on the JdK RS-Momentum scale. This setup suggests that NEM has ended its first leg of the relative uptrend and is now preparing itself for the second run. These turns inside the weakening quadrant are usually reliable triggers for a new part of the relative uptrend.
The upward breaks that are visible on the weekly price chart are supportive of a further rise in price, especially now that the recent decline of the $68.84 peak has held above the previous high, which started acting as support near $52.50. As long as $52.50 holds, the upward potential for NEM is bigger than downside risk with strong relative strength. That makes it an interesting stock for long positions.
FCX - Freeport McMoran Inc.
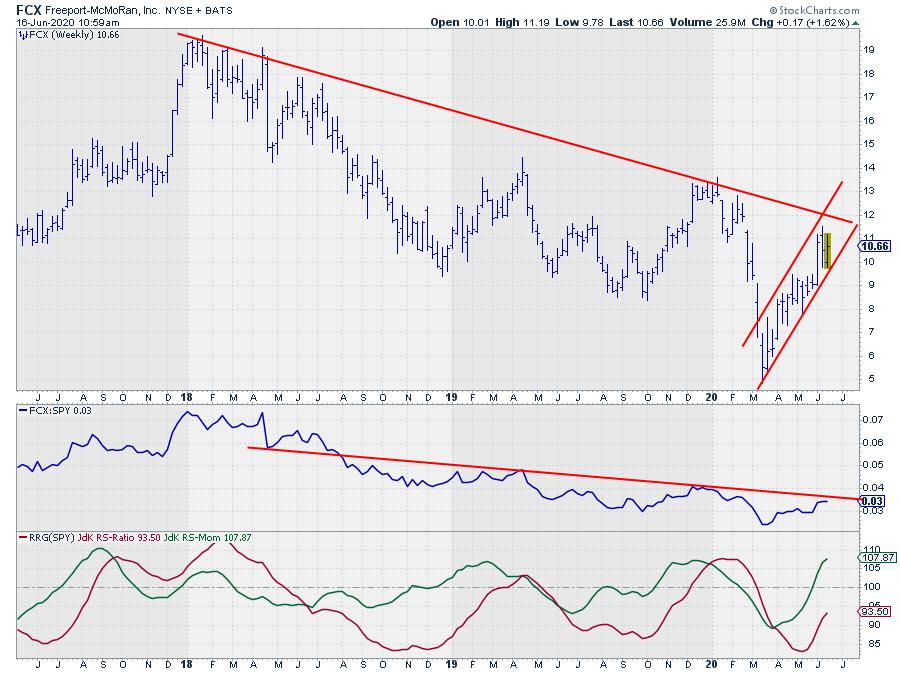
FCX is another stock in the materials sector. Where NEM has been one of the drivers for XLB in past months, FCX was lagging and in a relative downtrend for a long time. The chart above shows that price is moving lower already since the peak at the start of 2018, and relative strength started to deteriorate a few months later.
Both trends are still intact. Price is closing in on the falling resistance line that has run over the peaks since 2018, while relative strength is approaching its falling resistance that connects relative highs over the last year and a half.
The good news is the strong up-move in RS-Momentum, which puts the weekly tail vs. SPY high up in the improving quadrant and moving towards leading. On the daily RRG, FCX is already well inside the leading quadrant and currently losing a bit of momentum.
With price and RS approaching resistance, I am going to assume that the current momentum will be able to push through these levels and add FCX to the basket as a long idea. A more conservative approach would be to wait for an actual break above resistance.
This leaves us with the basket shown below at the moment.
#StaySafe, --Julius
Julius de Kempenaer
Senior Technical Analyst, StockCharts.com
Creator, Relative Rotation Graphs
Founder, RRG Research
Host of: Sector Spotlight
Please find my handles for social media channels under the Bio below.
Feedback, comments or questions are welcome at Juliusdk@stockcharts.com. I cannot promise to respond to each and every message, but I will certainly read them and, where reasonably possible, use the feedback and comments or answer questions.
To discuss RRG with me on S.C.A.N., tag me using the handle Julius_RRG.
RRG, Relative Rotation Graphs, JdK RS-Ratio, and JdK RS-Momentum are registered trademarks of RRG Research.


