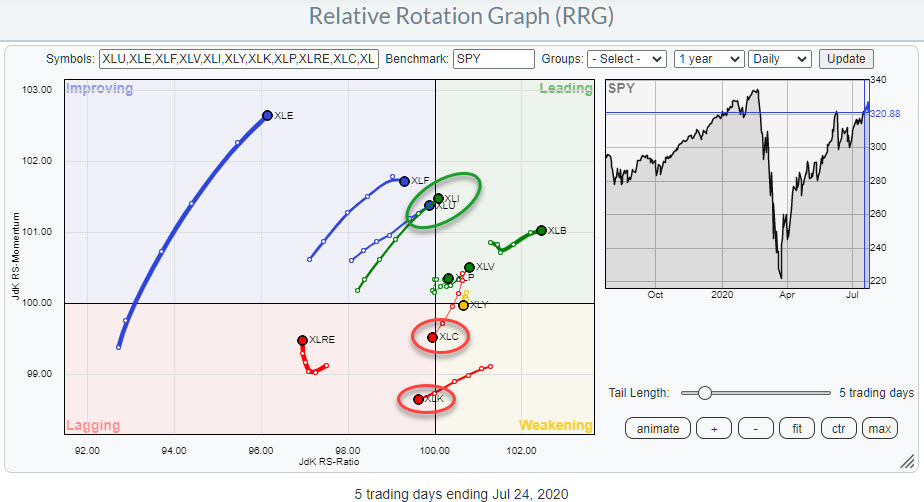
Following Friday's close, we are facing a daily Relative Rotation Graph with some interesting (sector) rotations underway.
Energy
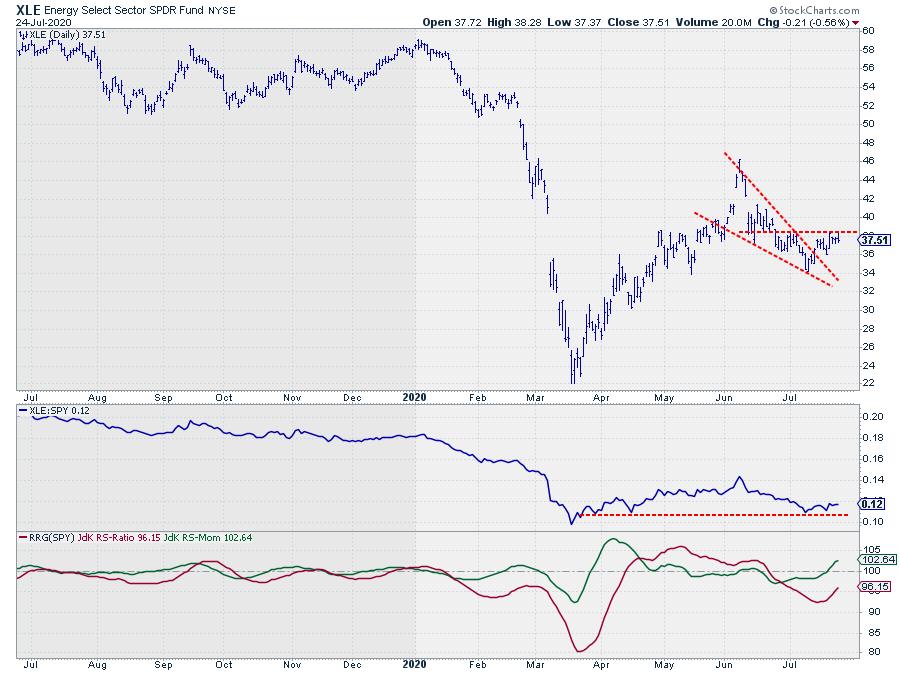
The Energy sector had a pretty good week. This comes after I suggested more weakness for this sector in Sector Spotlight on Tuesday 7/21... I recorded that show on Monday 7/20 and, of course, on that Tuesday XLE jumped 6%... sure... ahummmm .
And that is what is puzzling me with this sector recently. It shows pretty good performances from time to time in the last few months, but it still remains the weakest sector on both the daily and the weekly scales when measured on JdK RS-Ratio.
The relative momentum (JdK RS-Momentum) is good, but the relative trend lags the S&P and other sectors. So, from a relative perspective, I am going to stick with what I see on the RRGs, which is still a recovery within a long-winded relative downtrend. Until further notice ;)
The price chart, however, is showing a potential falling wedge, which was recently executed and is waiting for a final confirmation. The wedge is annotated in the chart above and the short-term horizontal resistance level is marked around $38.60. When that level can be taken out, more upside potential for XLE will be unlocked, initially towards the gap area around $42 and, after that, the top of the wedge which is at $46.
We will have to see whether that long tail on XLE will hold enough power (=momentum) to take it all the way up and (in)to the leading quadrant.
Strong Rotations
Industrials
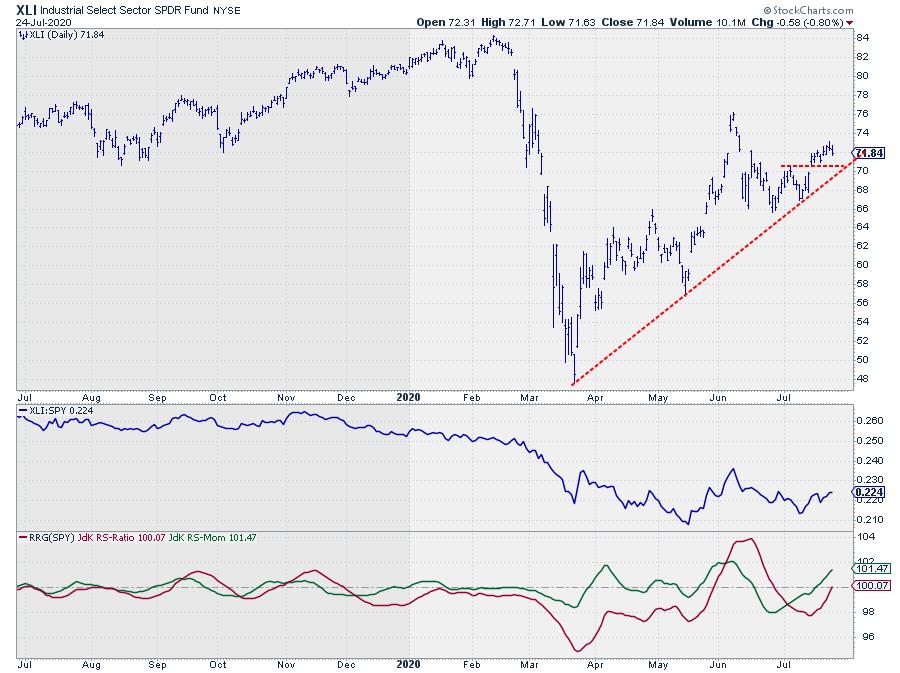
A strong rotation on the RRG is visible for the Industrials sector. At Friday's close, XLI moved over into the leading quadrant from improving. It is doing so at a positive RRG-Heading.
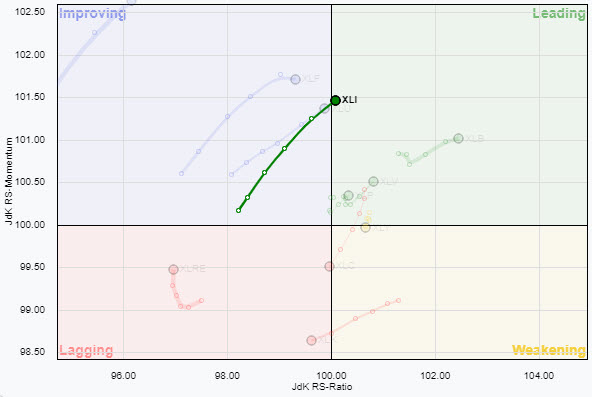
The stable RRG-Heading on the XLI tail suggests a further move into the leading quadrant in the coming days, maybe weeks. The support for such a move will need to come from the price chart, where XLI has just put in a new higher low against the rising support line that comes out of the March low.
The line, with the third touch-point, has now become a proper trendline. The old short term resistance just above $70 should now start to act as support in case of setbacks.
All in all, the Industrials sector looks to be lined up for a good week.
Utilities
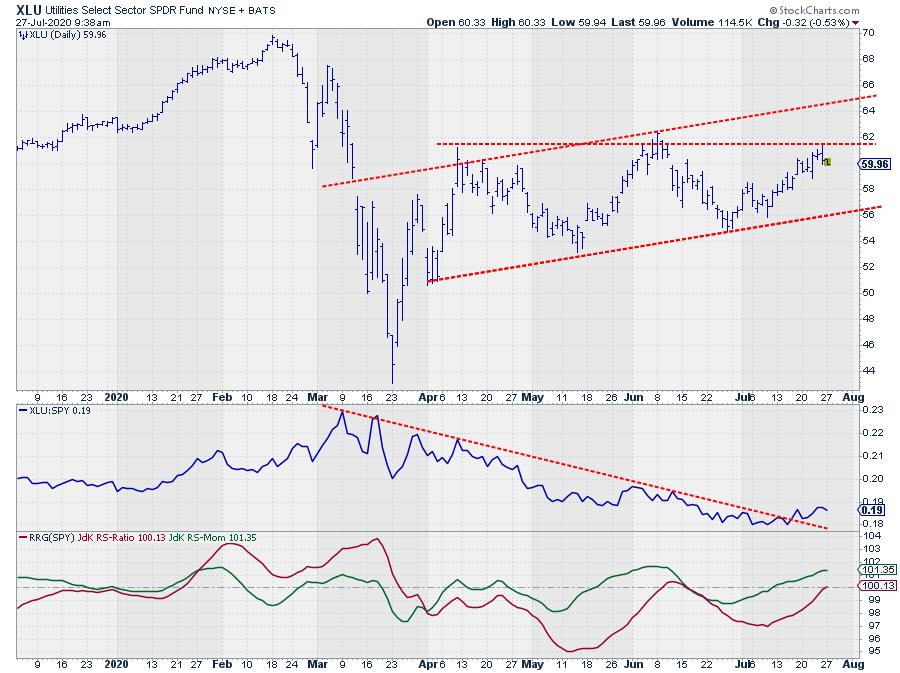
The second strong rotation on this daily RRG is for the Utilities sector. The tail is almost straight and about to cross over into the leading quadrant.
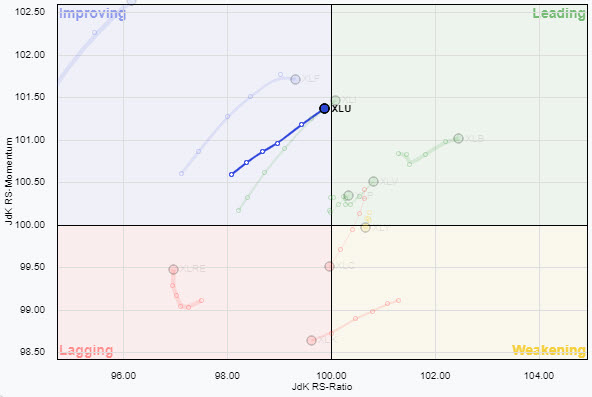 Compared to the XLI tail, XLU has a slightly higher RRG-heading, which means a little less momentum.
Comparing the price chart for both sectors, we see that XLI already managed to take out short term resistance, while XLU just bounced off its short-term horizontal resistance near $62. The relative strength chart for XLU, on the other hand, shows a more pronounced break from a five-month downtrend.
The improvement in relative strength usually needs to come from an improvement in price. However, as this is a notoriously defensive sector, things may go the other way around when the market takes a breather and people start to see refuge in Utilities. In that case, the relative strength that comes from investors moving to defense will push the price above its resistance.
The upside potential for now seems limited to the boundaries of the emerging rising channel, as annotated on the chart above.
Weak Rotations
Communication Services
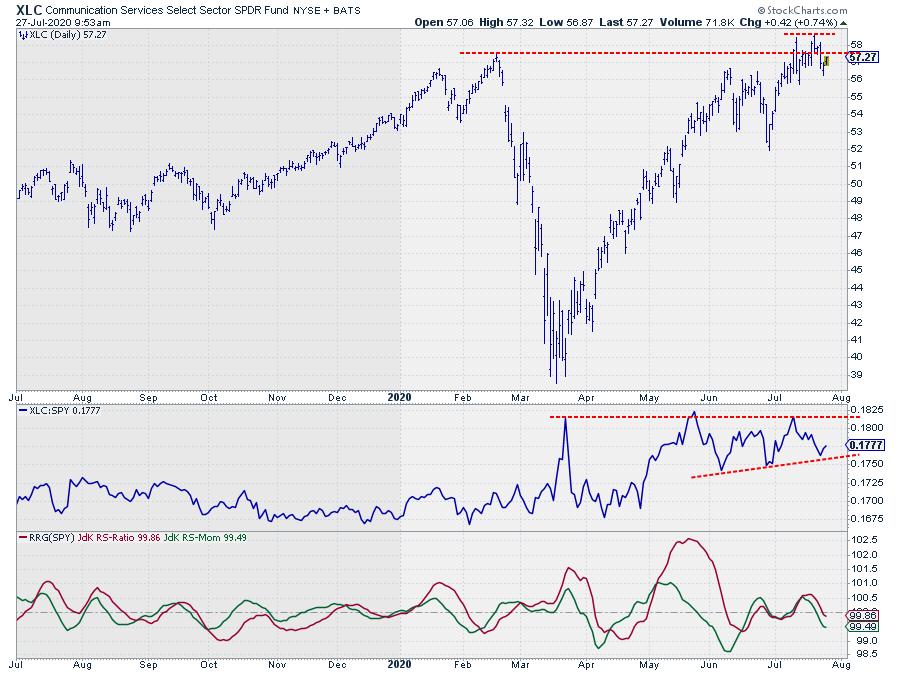
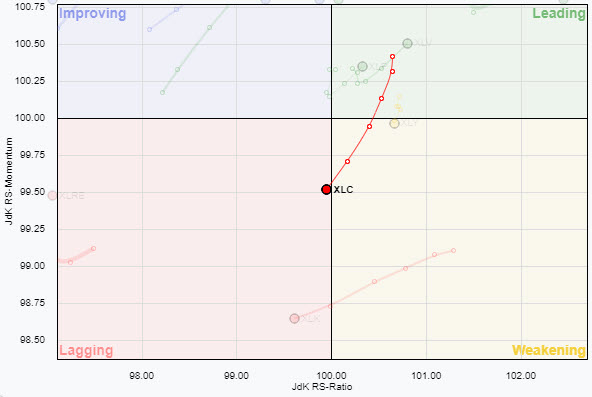
At the other side of the RRG (in the lower half), we find the Communications Services sector rotating from the weakening quadrant into lagging.
This rotation follows the struggle of XLC in the resistance zone between $57-$58.
For the last two weeks, XLC has been trying to clear a cluster of resistance levels that has shown up in that area. See the marked highs on the chart above.
All these peaks were formed in, or close to, that $57-$58 area. It is also a nice example of the fact that marking support and resistance is not an exact science. Most of the time, at least, it does not happen that a specific level shows up as clear support or resistance. Usually, it comes as a range or an area.
The inability to clear that area of resistance in the last few weeks has caused relative strength to lose momentum as the market itself (SPY) did manage to move higher.
This recent turn on the daily RRG is now moving in line with the XLC tail on the weekly RRG, which is moving at a negative RRG-Heading and just crossed into the weakening quadrant, but still at a good RS-Ratio level.
So the longer term relative trend for XLC is still up and the current rotation on the daily RRG appears to be a temporary setback for the time being.
I am going to keep an eye out to see if XLC is able to rotate quickly through the lagging and improving quadrants and get back towards leading, or at least back to a positive RRG-Heading, before the weekly tail weakens further.
Technology
 The mother of all sectors is taking a breather, at least for now.
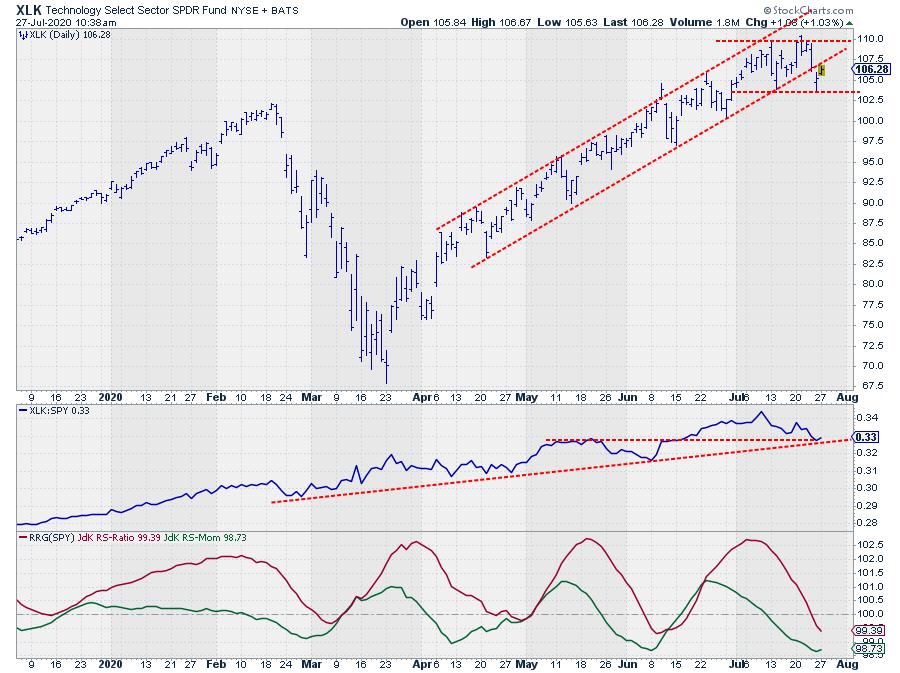
With XLK trading comfortably above its early 2020 (all-time) high, the rhythm of higher highs and higher lows is fully intact on the weekly chart for both price and relative strength, meaning it is difficult to get super-bearish for the sector. Nevertheless, it looks like it is taking a little break from its power run.
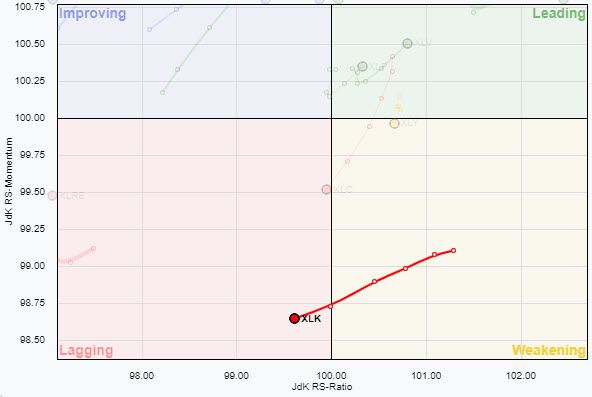
This best visible on the daily Relative Rotation Graph at the top of the article and the highlight in the small chart here. After a stellar rotation, XLK has now moved from the leading quadrant through weakening and into lagging.
On the daily chart above, the rising channel from April onwards seems to be broken, causing limited upside potential. And XLK is looking to start moving in a small trading range between $103.50 and $110.00 for the time being.
The recent struggle to move past $110 has caused negative rotation on the daily RRG, which is dragging the weekly tail down as well. But, with the (very short) weekly tail just inside the weakening quadrant and XLK still at the highest weekly RS-Ratio reading for the whole universe, I am going to judge this move as temporary, just like XLC.
When the weekly tail remains inside weakening and does not deteriorate too far, a turn for the daily tail back into the 0-90 degree RRG-Heading could be an interesting re-entry possibility.
#StaySafe, --Julius
Julius de Kempenaer
Senior Technical Analyst, StockCharts.com
Creator, Relative Rotation Graphs
Founder, RRG Research
Host of: Sector Spotlight
Please find my handles for social media channels under the Bio below.
Feedback, comments or questions are welcome at Juliusdk@stockcharts.com. I cannot promise to respond to each and every message, but I will certainly read them and, where reasonably possible, use the feedback and comments or answer questions.
To discuss RRG with me on S.C.A.N., tag me using the handle Julius_RRG.
RRG, Relative Rotation Graphs, JdK RS-Ratio, and JdK RS-Momentum are registered trademarks of RRG Research.


