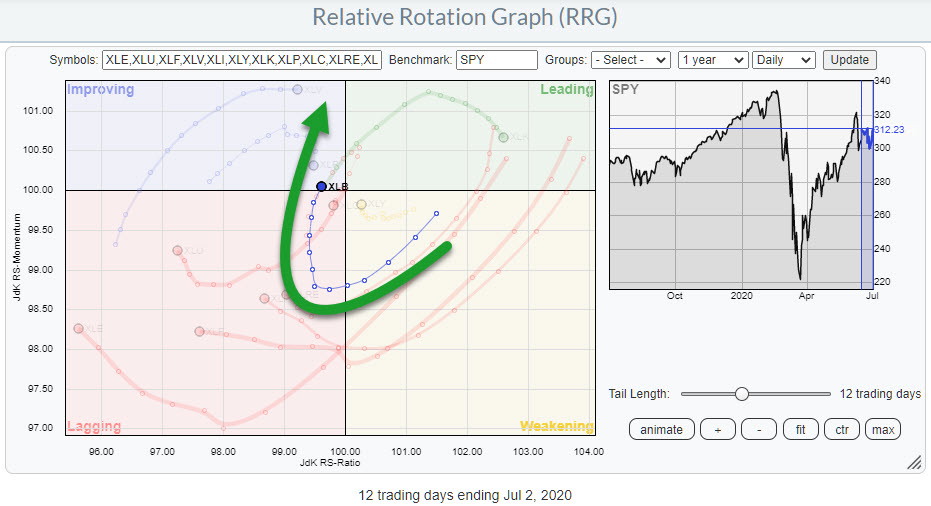
I hope all of you had a great (long) 4th of July weekend. At the end of the short trading week, the Materials sector turned into a 0-90 degree heading on the Relative Rotation Graph as it crossed over into the improving quadrant from lagging at the same time.
This turn now makes XLB one of the few sectors traveling at a positive RRG-Heading. Another one is XLY, the Consumer Discretionary sector, inside the weakening quadrant. There's also Health Care inside improving but this one is pretty much at 90 degrees, which means it is still gaining in relative strength but lacking real relative momentum.
Getting Back in Sync with the Weekly Rotation
When we combine the rotation of XLB on the daily chart with the tail on the weekly RRG, things get even more interesting.
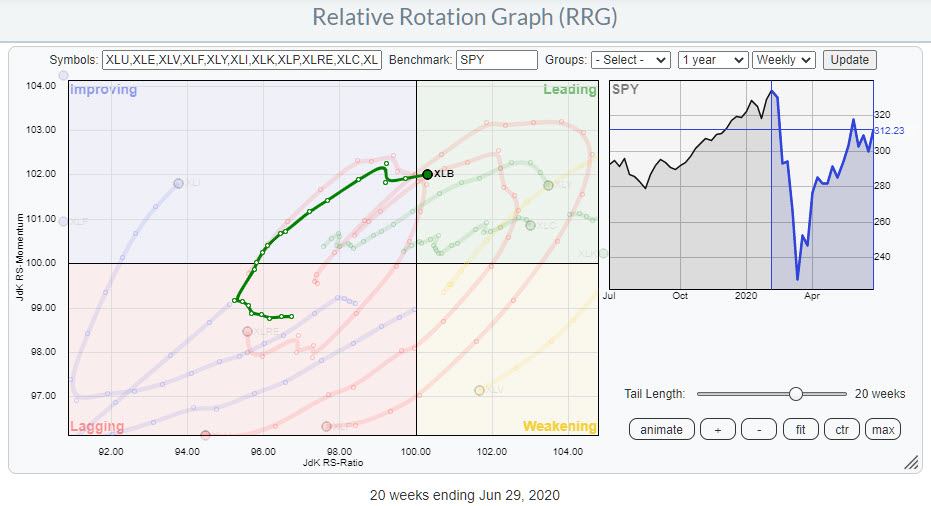
The XLB tail started to improve at the start of April when it turned to a 0-90 degree heading and followed through strongly as it rotated through the improving quadrant.
The small hiccup three weeks ago syncs with the rotation on the daily RRG, where the tail rolled over inside the leading quadrant around 11 June, then rotated through all quadrants to where it now is, as shown in the daily RRG at the top of this article. This means that both tails are now moving in sync and reinforcing each other.
A Look at the Price Charts
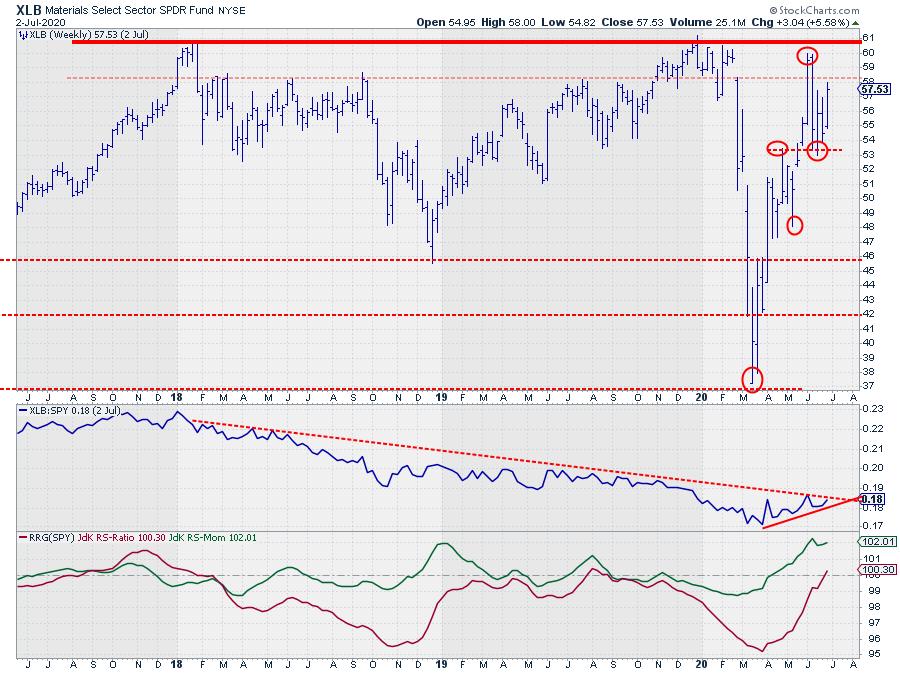
On the weekly chart, XLB is still facing overhead resistance between $58-61. After a test inside that range a few weeks ago, price dropped back, but managed to set a new higher low at the level of a previous high. This means that the rhythm of higher highs and higher lows is still intact. A new move higher is now underway.
The RS-Line is pushing against its falling resistance line. A break higher will fuel the recent improvement that has already been picked up by both RRG-Lines rising above the 100-level.
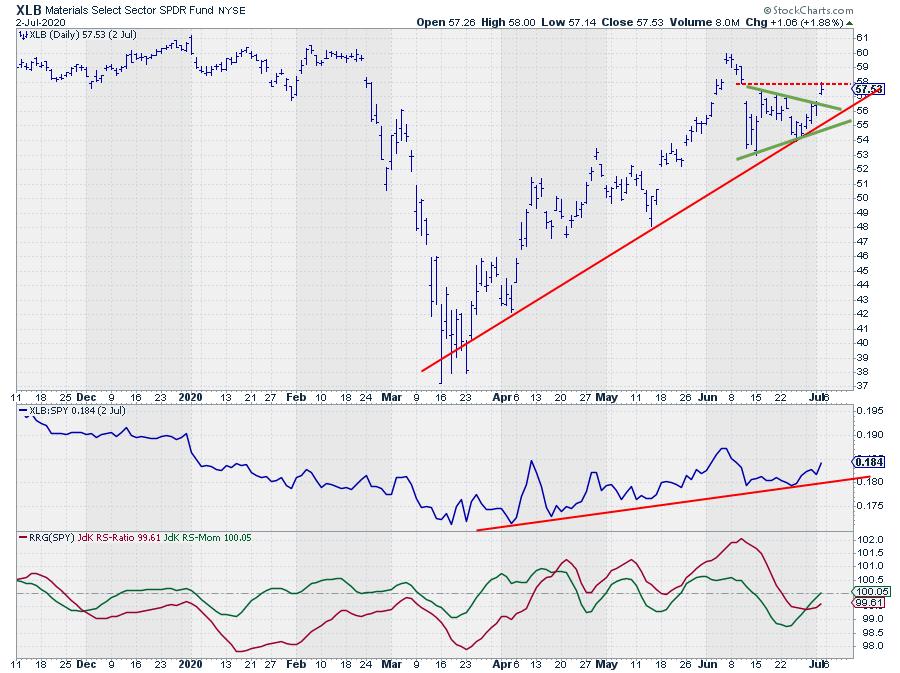
The daily chart shows recent movements in more detail. The RS-Line is on the way up, showing a nice sequence of higher highs and higher lows. The recent upward turn of the red JdK RS-Ratio one has caused the turn of the tail to a positive RRG-Heading.
On the price chart, the series of higher highs and higher lows is magnified and clearly visible, and so is the consolidation after setting the recent high at $61 at the start of June.
The gap higher out of the consolidation pattern last Thursday suggests that demand is coming back for material stocks, which is lining the sector up for a good week, especially if it can break the intermediate resistance level at $58 coming off the previous gap down.
#StaySafe, --Julius
Julius de Kempenaer
Senior Technical Analyst, StockCharts.com
Creator, Relative Rotation Graphs
Founder, RRG Research
Host of: Sector Spotlight
Please find my handles for social media channels under the Bio below.
Feedback, comments or questions are welcome at Juliusdk@stockcharts.com. I cannot promise to respond to each and every message, but I will certainly read them and, where reasonably possible, use the feedback and comments or answer questions.
To discuss RRG with me on S.C.A.N., tag me using the handle Julius_RRG.
RRG, Relative Rotation Graphs, JdK RS-Ratio, and JdK RS-Momentum are registered trademarks of RRG Research.


