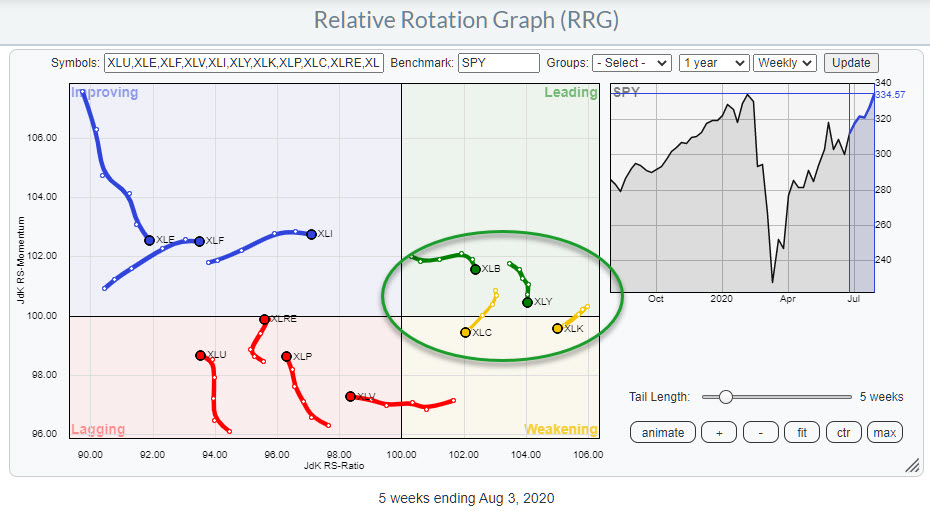
The weekly Relative Rotation Graph for US sectors shows four sectors at the right-hand side of the plot, JdK RS-Ratio > 100 and all seven other sectors at the left-hand side. This indicates that, from a relative strength perspective, the market is driven by only four sectors. But those four include the largest sector by far, Technology, and that is why more sectors are located to the left, keeping RRG in balance.
Looking at the weekly tails of these four sectors, we see that none are at a positive RRH-Heading; XLC and XLK are even at a negative RRG-Heading. XLB and XLY are inside the leading quadrant and rolling over. Nevertheless, all of these sectors are still in a relative uptrend vs. SPY and all other sectors to the left.
That image changes when we move to the daily RRG for this universe, where you can see much more and faster rotation going on.
The RRG below shows that rotation for those four sectors mentioned above for better clarity.

What is interesting to see is that the two sectors (XLK and XLC) that are rotating in a South-Western direction on the weekly chart are rotating exactly opposite on the daily RRG. With the high RS-Ratio reading on the weekly RRG and the strong rotation on the daily RRG, this suggests that the weekly tails inside the weakening quadrant are likely to start curling up again soon. Essentially, it marks a continuation of the strong relative uptrends for these sectors.
Materials (XLB) and Consumer Discretionary (XLY) are rolling over inside the leading quadrant, while their daily tails are traveling through weakening and heading towards lagging.
It looks as if XLC and XLK are ahead in the rotation process and that XLY and XLB are following. For the near-term, that suggests strength for XLK and XLC and weakness for XLY and XLB while all remain in their long term (relative) uptrends.
Consumer Discretionary

The relative strength line on this chart especially nicely shows the working of momentum. From the low in the RS-Line at the end of March, RS rises steeply until it reaches the overhead resistance coming from the 2019 highs, where the rally stalls.
In the RRG-Lines, the green RS-Momentum line rallies during the run-up in RS, but when RS starts to stall, RS-Momentum immediately rolls over. Once the horizontal barrier is broken, the RS-Line continues to rise, but at a lesser pace. This is reflected in the RS-Ratio line, which is still above 100 but levels off due to the loss of momentum.
This illustrates perfectly that a security can be in a relative uptrend while losing relative momentum. Once the green JdK RS-Momentum line drops below 100, the tail on the RRG will enter the weakening quadrant. When the deterioration continues and the uptrend cannot be maintained, the tail will roll over to the lagging quadrant when both RRG-Lines drop below 100.
For now, RS is still above its resistance level and price is well above its own breakout level, which gives the tail on the daily RRG plenty of opportunity to rotate and come back to a positive heading, supporting the longer-term trend.
Materials

The situation for Materials is not as clear as for Discretionary, as XLB is still struggling to break horizontal resistance in the RS-Line.
On the price chart, XLB is holding up well above its breakout level. If price can hold these levels and rally a little further, the Relative Strength will very likely get a boost as well, which can then cause the daily tail to rotate through lagging and improving back to leading, supporting the longer-term uptrend again.
Communication Services

Both price and relative strength are holding up well after breaking their resistance levels. The sideways movement in relative strength after breaking out of the range is causing the dip in JdK RS-Momentum and the rolling over of RS-Ratio.
With the daily tail on XLC pushing towards the leading quadrant while currently inside improving, this sector could soon be back in a new up-leg within the longer term relative trend! A break above the recent relative highs will certainly help.
Technology

The flat movement of both the RS-Ratio and the RS-Momentum lines causes the short tail on XLK, while the high reading on RS-Ratio indicates that the relative uptrend is full intact.
There is gap support around $110 after last week's jump that may get closed, but all in all this uptrend is fully intact and a continuation of the daily tail into the leading quadrant will very likely support a further improvement of the weekly tail, i.e. helping it turn back up while inside the weakening quadrant.
#StaySafe, --Julius
Julius de Kempenaer
Senior Technical Analyst, StockCharts.com
Creator, Relative Rotation Graphs
Founder, RRG Research
Host of: Sector Spotlight
Please find my handles for social media channels under the Bio below.
Feedback, comments or questions are welcome at Juliusdk@stockcharts.com. I cannot promise to respond to each and every message, but I will certainly read them and, where reasonably possible, use the feedback and comments or answer questions.
To discuss RRG with me on S.C.A.N., tag me using the handle Julius_RRG.
RRG, Relative Rotation Graphs, JdK RS-Ratio, and JdK RS-Momentum are registered trademarks of RRG Research.


