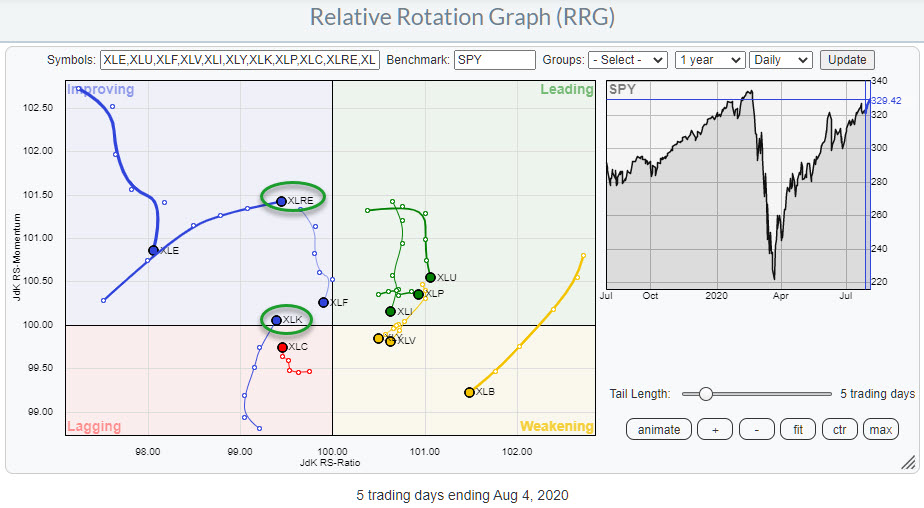
At the start of the week, two tails on the Relative Rotation Graph for US sectors are showing interesting rotations. These are the tails for for XLRE and XLK.
Real Estate
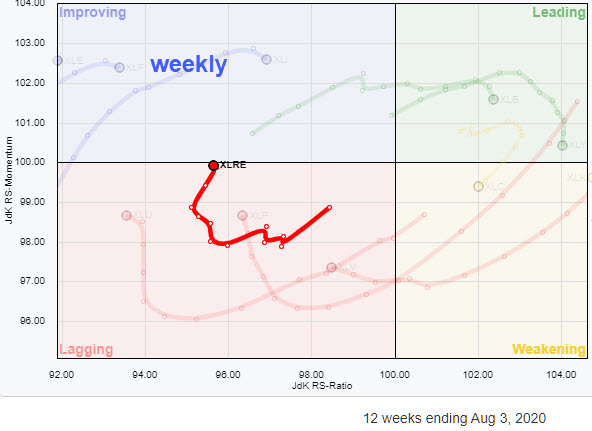 The positive rotation for the daily tail on the RRG coincides nicely with the improvement for XLRE on a weekly basis.
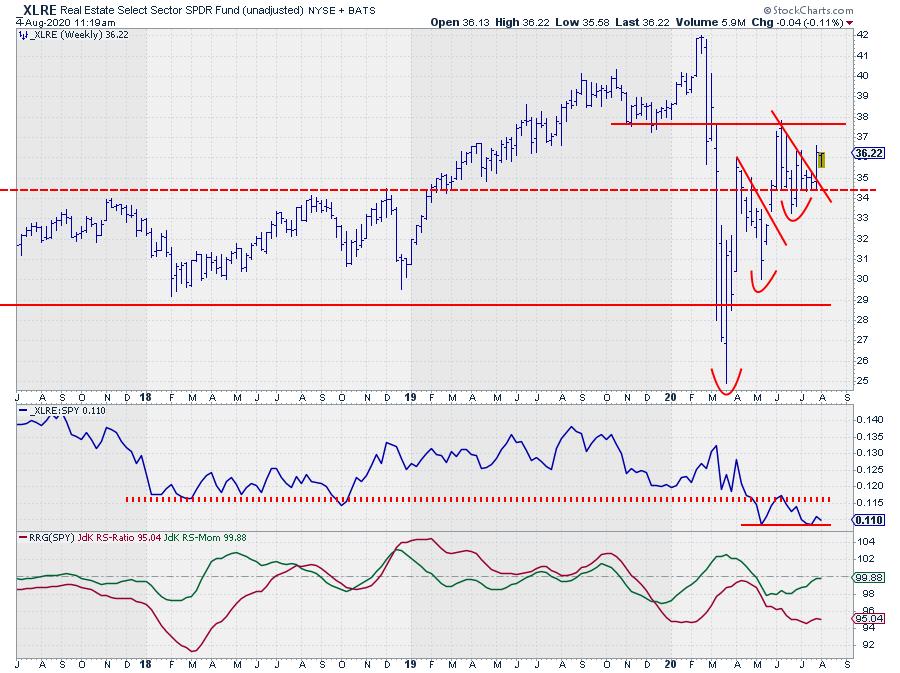
On the RRG, XLRE is still inside lagging, but is close to crossing over into improving. But, more importantly, on the weekly bar-chart the sector just broke out of a two-month consolidation pattern and started working its way higher, while respecting former highs and lows as new support and resistance levels and setting a new higher low.
The next hurdle that comes in sight for XLRE is the horizontal barrier just below $38. The dashed horizontal line just above $34 is expected to serve as support in case of new setbacks. The newly formed low in the RS-Line looks promising, as it held at the level of the previous low and did not move lower.
All in all, the Real Estate sector seems to be improving further and the positive heading on the daily tail suggests more strength ahead in coming days/weeks.
Technology
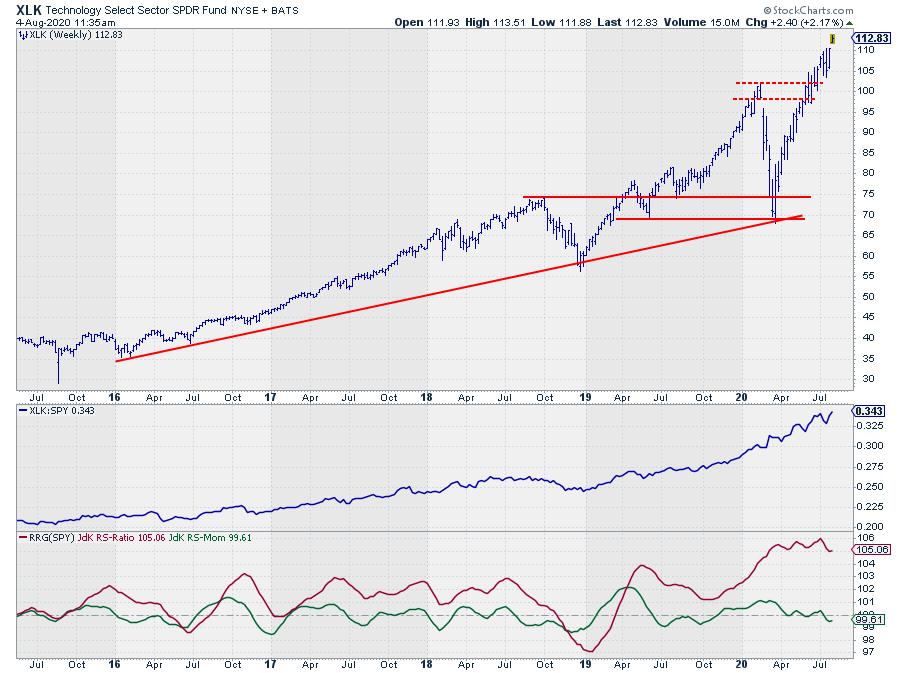
The weekly chart of the Technology sector remains in a very steep rising trend.
There were, and are, many reasons to maintain a more cautious approach to investments in this sector. But, at the end of the day, you cannot afford to not own any tech stocks, at least not if you want to make a decent return in this market and/or beat the S&P 500.
It's one of these situations where pretty much everybody thinks the sector (or the market) should make a high, and everybody can come up with plenty of reasons why it should come off, at least a little bit. But the problem is that all the people arguing that the sector or the market "should" go down most likely have already sold (at least part of) their holdings. SO it is what they want to see happening.
If these are professional fund managers, then it is particularly a problem, because when the market does not come down as they expected, they HAVE to get back into the sector/market at higher prices, which will create even more demand and further rising prices.
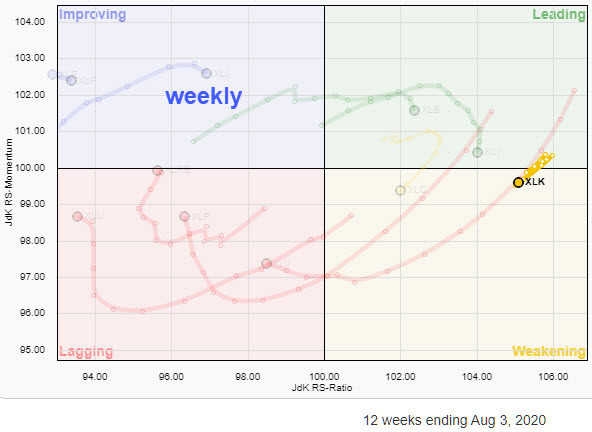
How far can this continue?? No one knows, but, as the saying goes, the market can remain irrational longer than you can remain solvent, so the most important thing to do is definitely not go AGAINST a trend like this. After all, as you can see on the weekly RRG (inset), XLK still is the sector with the highest RS-Ratio and a very short tail, meaning that it is a very stable relative uptrend.
The move into weakening on both the weekly and the daily RRGs, which I mentioned a few times in articles and in Sector Spotlight since 20 July, suggested some short-term weakness.
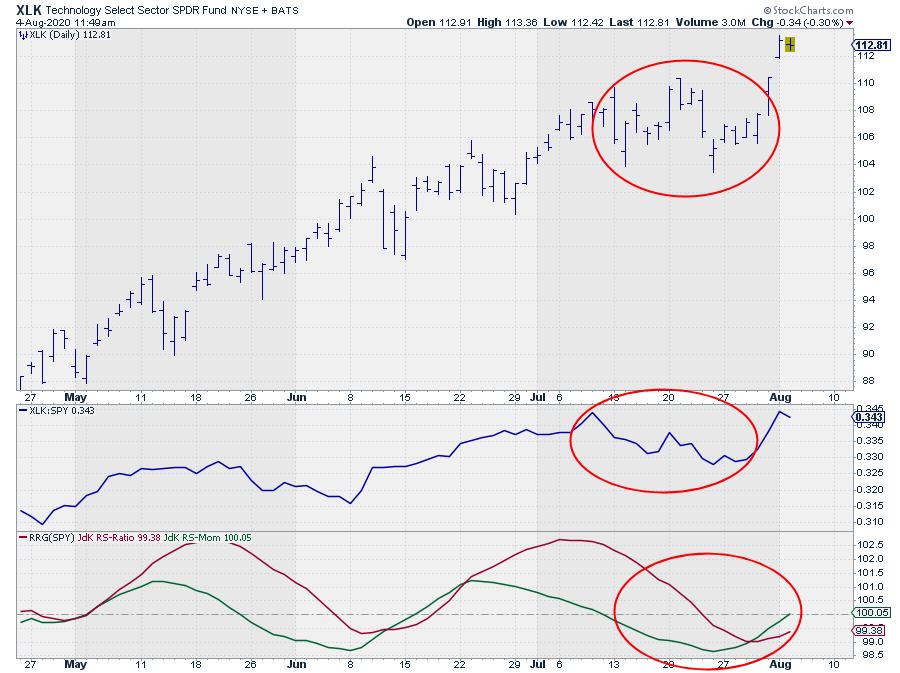
And that short term weakness did indeed come, but it lasted a lost shorter than (at least what I) expected.
This week's opening yesterday morning caused a (breakaway or runaway?) gap on the chart. As long as XLK holds above gap support, that signals a, strong further rally, which is now supported by a strong heading once again on the daily RRG tail for XLK.
The risk here on this particular chart, as I see it is the risk of this gap becoming an exhaustion gap and the potential forming of an island. But we will not know that until it happens, and it may never happen, or not happen in the coming weeks.
All in all, tech remains the strongest sector, without a doubt, but at the same time it is the sector with the highest risk. So, I would say, "handle with care" and be careful and selective.
#StaySafe, --Julius
Julius de Kempenaer
Senior Technical Analyst, StockCharts.com
Creator, Relative Rotation Graphs
Founder, RRG Research
Host of: Sector Spotlight
Please find my handles for social media channels under the Bio below.
Feedback, comments or questions are welcome at Juliusdk@stockcharts.com. I cannot promise to respond to each and every message, but I will certainly read them and, where reasonably possible, use the feedback and comments or answer questions.
To discuss RRG with me on S.C.A.N., tag me using the handle Julius_RRG.
RRG, Relative Rotation Graphs, JdK RS-Ratio, and JdK RS-Momentum are registered trademarks of RRG Research.


