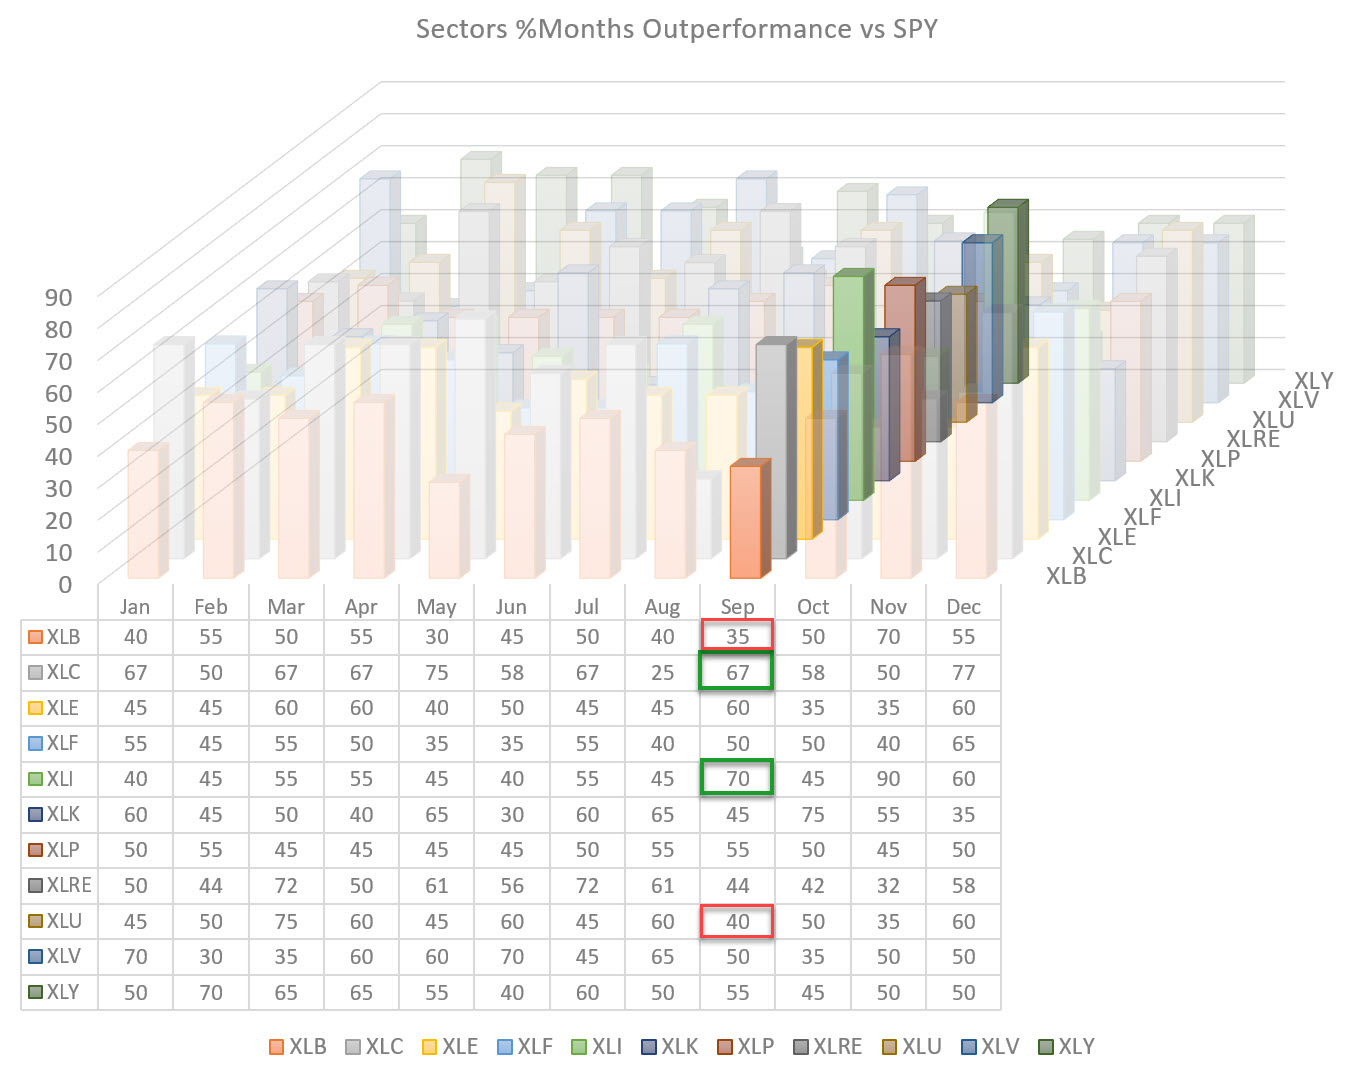
The graph above shows the percentage of months in which sectors have outperformed the S&P 500 in the past. For most sectors, the data go back 20 years, with the exceptions of XLC and XLRE, as these sectors were only introduced more recently and the historical data does not go back that far (back-filled).
Seasonal Over- / Under-Performance
This is a chart that I show at the start of or shortly before a new month begins in my weekly show Sector Spotlight. For the coming month of September, there are a few interesting observations to make.
On the positive side, two sectors stand out - Communication Services at 67 and Industrials at 70. This means that historically, 67% or 70% of the months of September have led to an outperformance over SPY. These are interesting numbers that are worth further investigation.
On the negative side, we see 35% for Materials and 40% for Utilities. These are also interesting numbers because 35% or 40% of historical outperformance means 65% or 60% of historical UNDERperformance, which is also a meaningful number.
Combining with RRG
Knowing these numbers can give us some additional information when we look at the Relative Rotation Graph for US sectors.
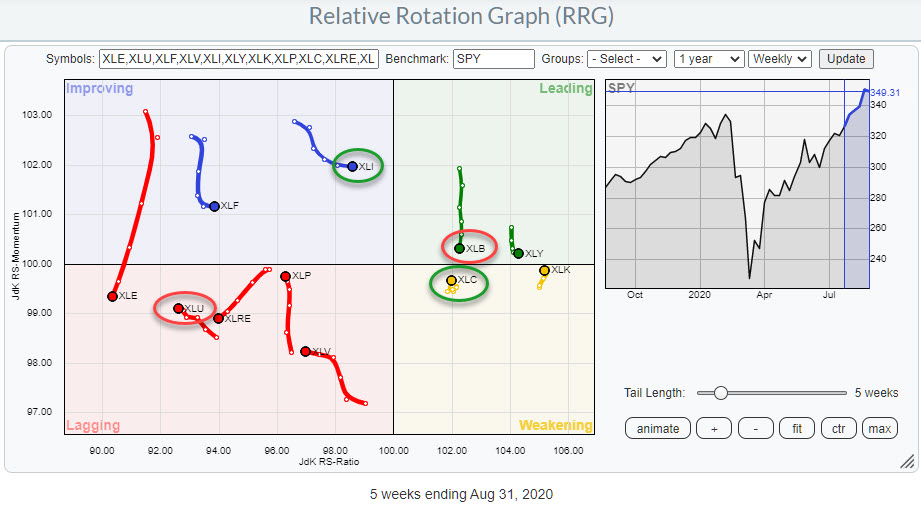
The RRG shows the current positions for all sectors. I have circled XLI and XLC green as their seasonality suggests a good performance relative to SPY in the coming weeks; I have also circled XLB and XLU red, as their seasonality suggests a weak performance against SPY in coming weeks.
The RRG below isolates and zooms in on these four sectors.
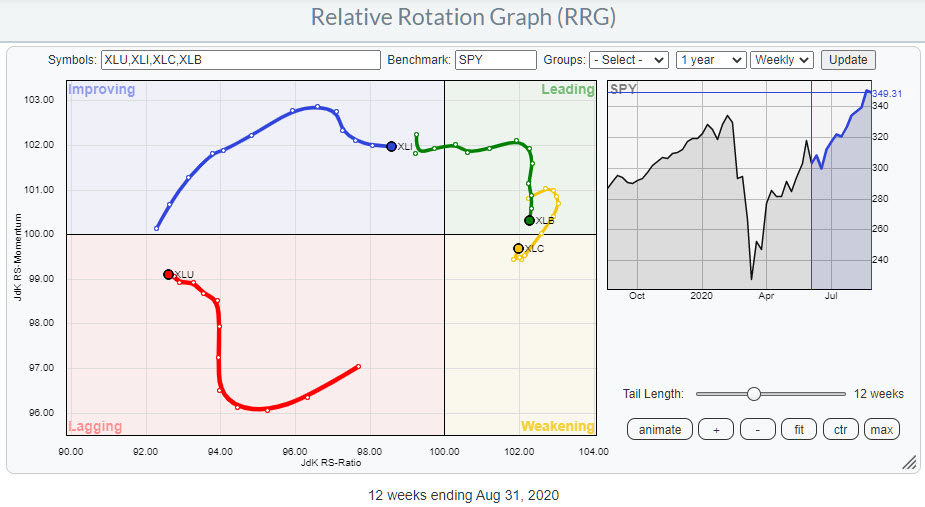
XLI and XLC Look Strong
Looking at the development and the trajectory of these tails, XLC looks strong. The sector crossed over from improving into leading mid-February and remained inside the leading quadrant until late July, when XLC dropped into the weakening quadrant.
Over the last 4-5 weeks, the RRG-Velocity (distances between the observations) started to decrease and eventually turned back up. It is now heading towards the leading quadrant once again. This sort of rotation is typical for the second leg in a relative uptrend that is already underway. So the positive rotation for this tail lines up pretty good with the expected outperformance for XLC in the coming month.
The tail on XLI is also looking pretty good, but is still inside the improving quadrant. The slight loss of relative momentum has recently leveled off and XLI has started to move higher on the RS-Ratio scale again. Hence, this improvement also aligns with the positive expectation for the Industrials sector based on Seasonality.
XLU and XLB Looking Weak
On the weak side, the XLU tail has started to head lower on the RS-Ratio scale after a few weeks of improving RS-Momentum. With the sector so deep inside the lagging quadrant and now heading lower on the RS-Ratio scale again, the weak expectation based on its seasonal performance aligns with the trajectory of the tail.
Finally, the Materials sector. On the RRG, the XLB tail is still inside the leading quadrant but has been moving almost straight down for a few weeks already, suggesting that there is more relative weakness ahead for this sector. This expectation aligns with the weak expectation from a seasonal perspective.
This leaves us with four sectors, two strong and two weak, which RRG-tails more or less align with the expected over- or under-performance based on their seasonal pattern.
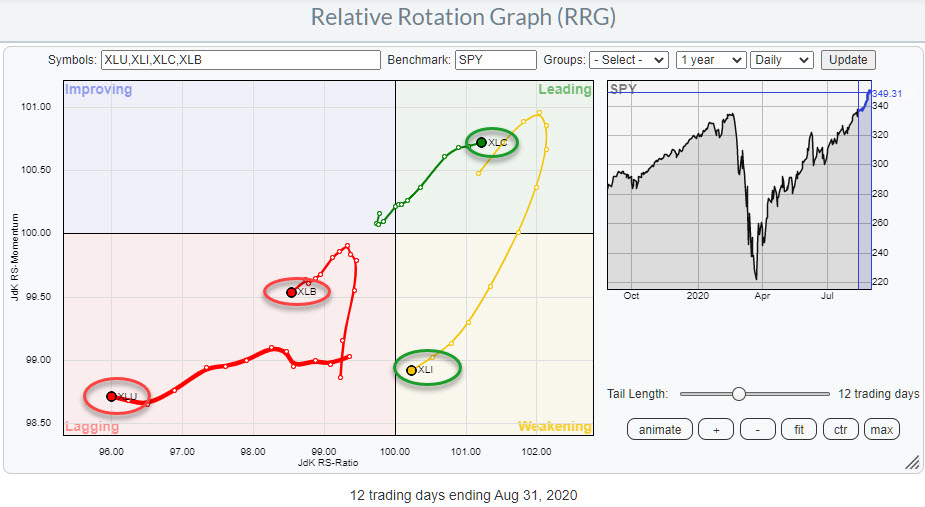
The RRG above shows the daily tails for these four sectors. The tails for XLB and XLU confirm the weakness that was visible on the weekly RRG. For XLC, the daily tail confirms the positive rotation that is underway for this sector on the weekly scale.
XLI, on this daily RRG, is rapidly heading towards the lagging quadrant, which contradicts the improvement that is visible on the weekly chart. These conflicting rotations make the positive outlook for XLI somewhat unreliable. It remains possible for XLI to turn back up and start heading towards leading, either still inside weakening or just after entering lagging, but the rotations and the outlook are definitely not as strong as for XLC.
The Historical Average Return vs SPY
Finally, we can look at the average historical over- or under-performance per month.
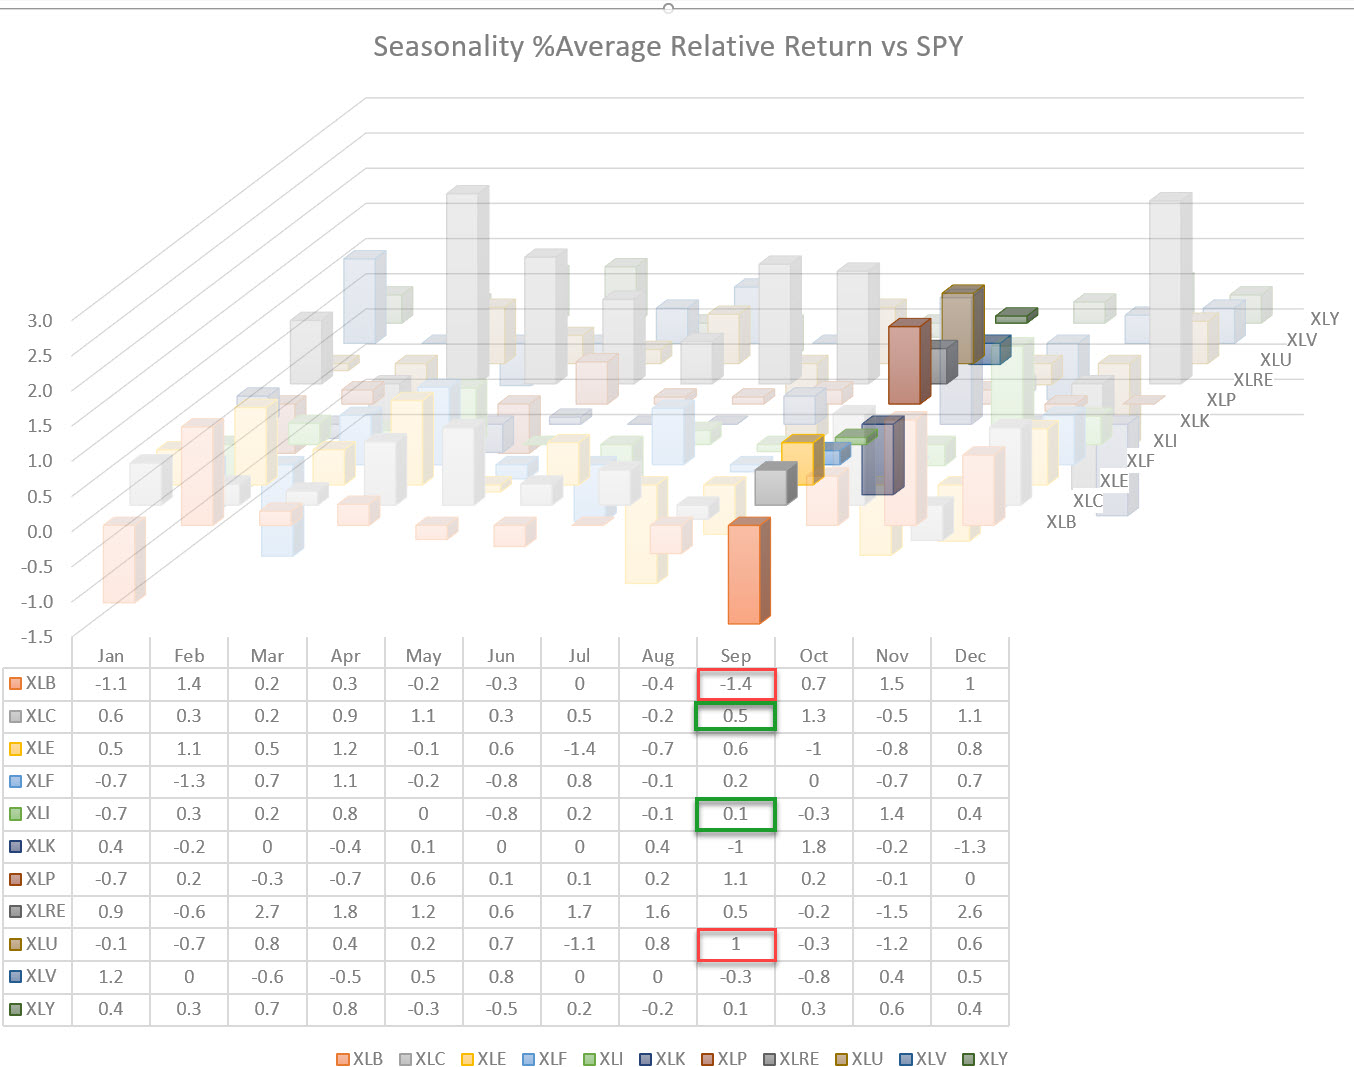
The image above shows the historical average over- or under-performance vs SPY. The average relative performance for XLC is 0.5% over SPY, which aligns with the expectation for an outperformance over SPY in coming month; this is backed up by a strong rotation on the weekly (and daily) RRG.
The expected outperformance for XLI is only 0.1%, so even although XLI managed to outperform SPY 70% of the time, it was only by a thin margin. Combining that with the conflicting rotations on the weekly and daily RRGs leads me to the conclusion that the outlook for XLI is not so reliable.
For XLU, the historical average performance is +1% over SPY. This does not match well with the observation that XLU has underperformed SPY 60% of the time. The conclusion has to be that, during the 40% of outperformance, the performance was exceptionally strong. So strong, in fact, that it manages to beat the 60% of underperformance.
All in all, these contradicting seasonal observations do not match well with the weak rotational pattern that is visible on the RRG.
Finally the Materials sector. An expected -1.4% underperformance vs. SPY matches the expected underperformance (65% of the time). The weekly tail is inside leading but rapidly deteriorating, while the daily tail already well inside the lagging quadrant confirm or aligned with the weak expectations based on seasonality.
Materials
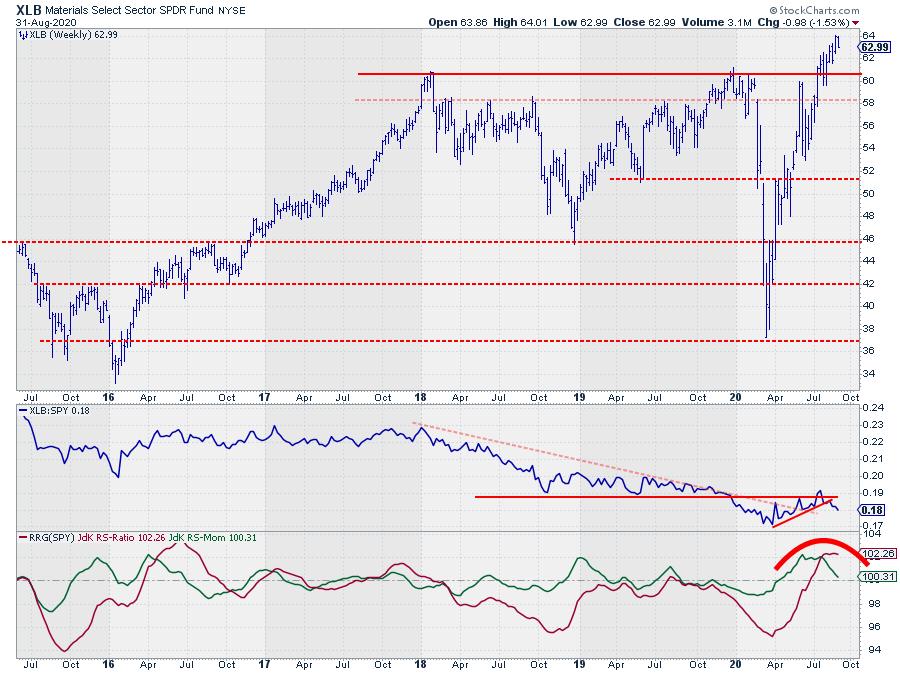
The RS-Line of XLB has just broken below a short-term rising support line confirming weakness. Price support is expected just above $60, the former resistance and current support level of the 2018 and 2019 peaks.
Communication Services
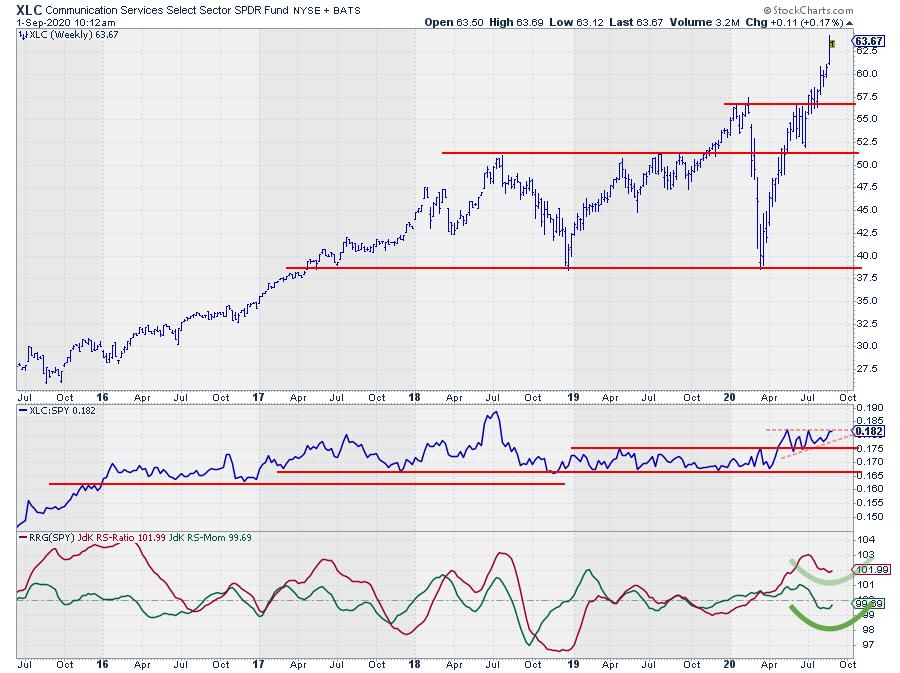
The RS-Line for XLC moved in an ascending triangle-like pattern after breaking out of the range a few weeks ago. An upward break out of this consolidation pattern in relative strength will fuel a further rotation into the leading quadrant.
Based on the above, it looks like we can expect an outperformance over SPY for XLC and an underperformance for XLB in coming month.
#StaySafe, --Julius
Julius de Kempenaer
Senior Technical Analyst, StockCharts.com
Creator, Relative Rotation Graphs
Founder, RRG Research
Host of: Sector Spotlight
Please find my handles for social media channels under the Bio below.
Feedback, comments or questions are welcome at Juliusdk@stockcharts.com. I cannot promise to respond to each and every message, but I will certainly read them and, where reasonably possible, use the feedback and comments or answer questions.
To discuss RRG with me on S.C.A.N., tag me using the handle Julius_RRG.
RRG, Relative Rotation Graphs, JdK RS-Ratio, and JdK RS-Momentum are registered trademarks of RRG Research.


