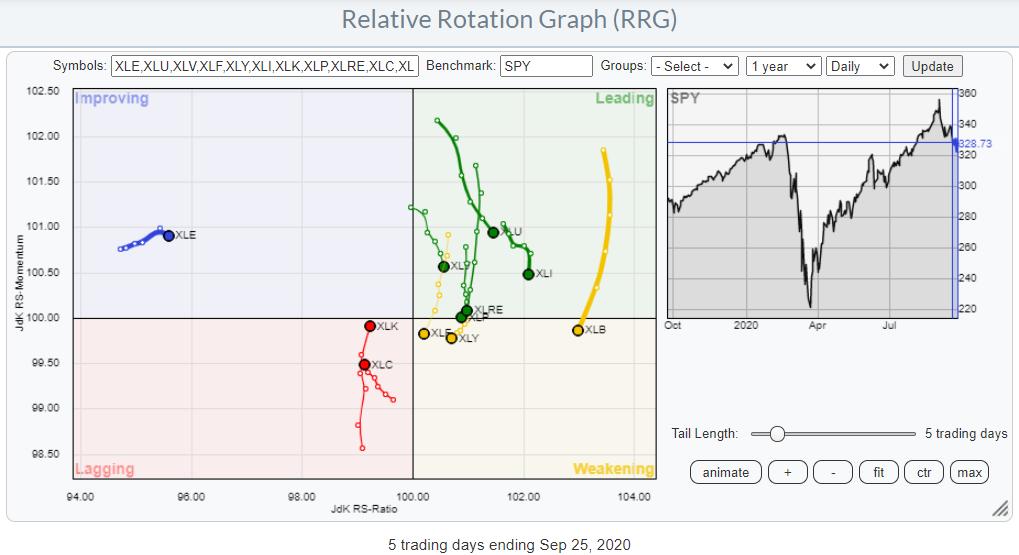
The erratic rotations that we discussed last week are still ongoing. Looking back at the rotational action on the RRG for US sectors last week shows that the focus of investors is shifting back to Technology and Communication Services again.
Despite being inside the lagging quadrant, XLK showed the strongest performance last week with a gain of 2.2%.
Now, before I get a ton of questions... ;) Yes, it is perfectly possible for a sector to rotate, say, through the lagging quadrant and have a positive performance or outperformance over the benchmark. It is also possible for a sector to rotate through leading and have a negative performance or underperformance.
The reason for this seemingly "unlogical" situation is the fact that RRG aims to detect "trends in Relative Strength." Hence, it does not show pure (relative) performance. Just like a trend on a normal (price-based) chart does not move up in a straight line, trends in relative strength also go through a series of rallies and setbacks, or higher highs and higher lows. Relative Rotation Graphs try to detect the best possible trend in these relative trends on the daily or the weekly time frame, then plot these on the RRG chart; these do not necessarily match with the actual (out-/under)performance.
Not only do the sharply rising tails for XLC and XLK inside lagging attract attention, but so do the tails for pretty much all sectors in the leading and weakening quadrants. They've moved almost vertically down and all, except XLY, have pretty long tails, indicating the swiftness of these moves.
To me, this still indicates a nervous market in which investors need to exercise extra caution. Things can change overnight.
Weekly
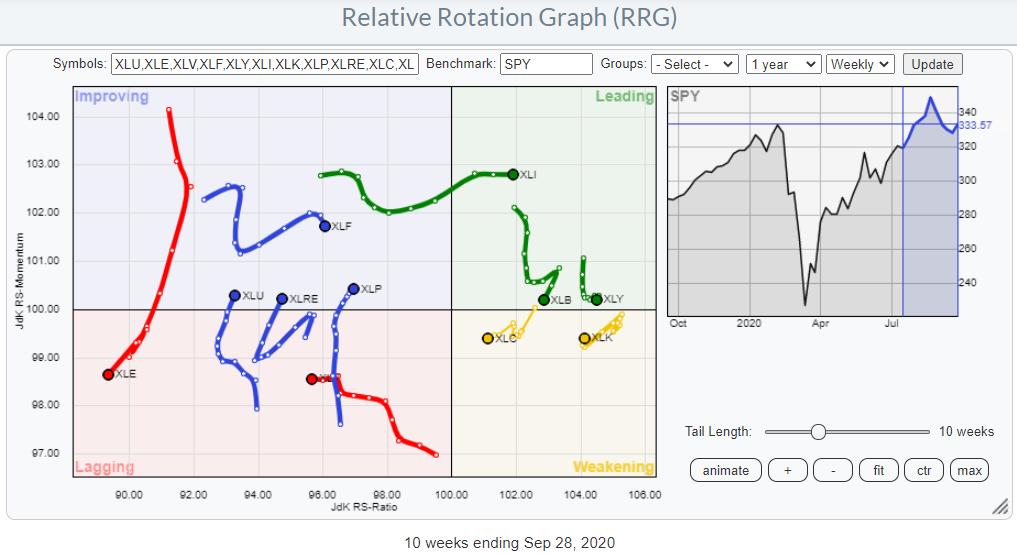
The erratic movements as we have seen them in the last weeks are now also starting to show on the weekly RRG. Where we normally see pretty smooth rotations in a clockwise direction and an occasional "hook," said hooks seem to be the norm at the moment. Just look at the tails on XLF, XLRE, XLC, XLK and XLB, to name a few that are very clearly visible. Since last week, the position for most of these tails has not changed significantly. XLK, XLC, and XLY remained very close to their previous positions and all are still well to the right of the chart, i.e. at a JdK RS-Ratio reading > 100.
The weakest tails are found on Energy, XLE, and Health Care, XLV. XLE continues to head deeper into the lagging quadrant on the weekly RRG, while its tail is starting to roll over downward inside the improving quadrant on the daily RRG. Both far away to the left = low on the RS-Ratio axis.
Health Care is not as far left as XLE, but is clearly heading lower on RS-Ratio scale, while the daily tail rolled over downward and is now pointing sharply down inside the leading quadrant on the daily chart. Given the proximity to the 100 level on the RS-Ratio scale, there is not much room for XLV to curl back up.
The clearest messages for this week are coming from Energy and Health care, and they urge caution or suggest further weakness for both.
Technology
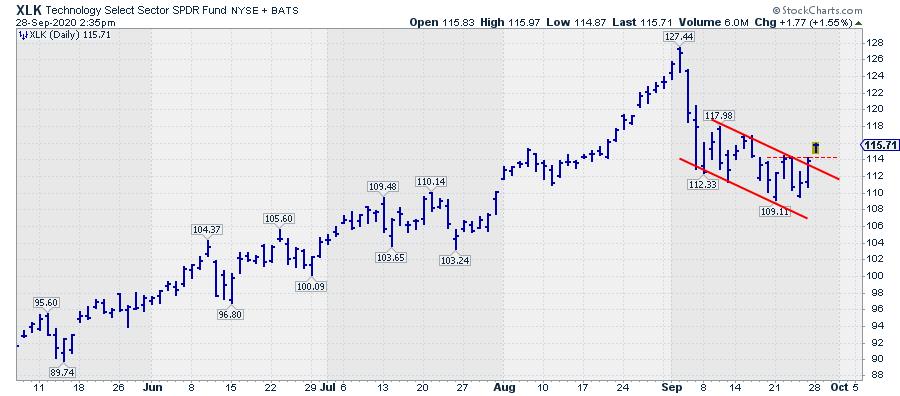
The technology sector seems to be breaking out of the short term downtrend at the start of this week which suggests an ongoing improvement in coming days. This could push the tail on the daily RRG further upward and help the weekly tail curl back up.
Energy
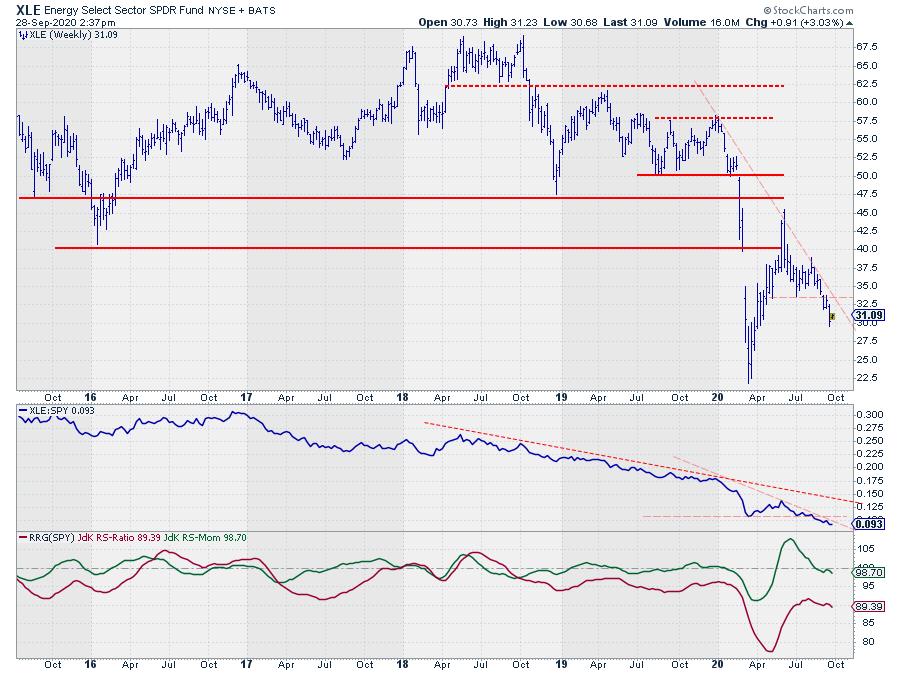
Energy remains an extremely weak sector. The acceleration lower after breaking the low/support around $33, after bouncing off the falling resistance line twice, confirms the weak rotation on the Relative Rotation Graph.
Health Care
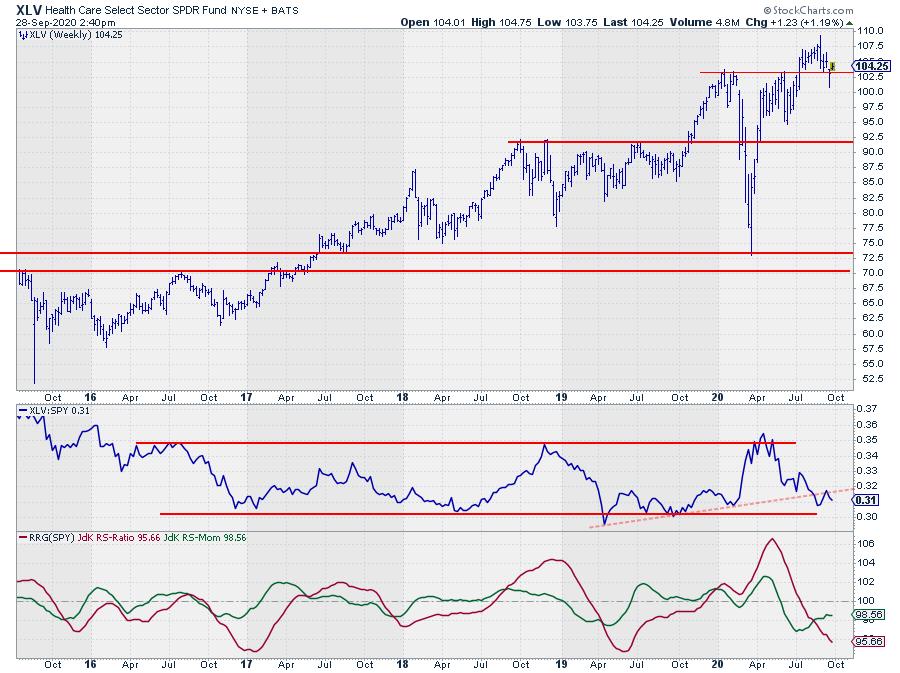
The price of XLV is hovering above its former resistance (now support) level near $104 and cannot really bounce off higher from this level like XLK, XLC, and XLY are doing at the moment. This failure to be able to do so in itself is already a sign of relative weakness; this becomes even more evident when we look at the raw RS-Line, which is still caught in a series of lower highs and lower lows which, in its turn, is pushing the RS-Ratio line lower. The recent hiccup in RS-Momentum seems to have run its course already and is ready to put in a high below the 100-line.
All in all, the attention this week goes to XLK and XLC for further improvement and XLE and XLV for more weakness.
#StaySafe, --Julius
Julius de Kempenaer
Senior Technical Analyst, StockCharts.com
Creator, Relative Rotation Graphs
Founder, RRG Research
Host of: Sector Spotlight
Please find my handles for social media channels under the Bio below.
Feedback, comments or questions are welcome at Juliusdk@stockcharts.com. I cannot promise to respond to each and every message, but I will certainly read them and, where reasonably possible, use the feedback and comments or answer questions.
To discuss RRG with me on S.C.A.N., tag me using the handle Julius_RRG.
RRG, Relative Rotation Graphs, JdK RS-Ratio, and JdK RS-Momentum are registered trademarks of RRG Research.


