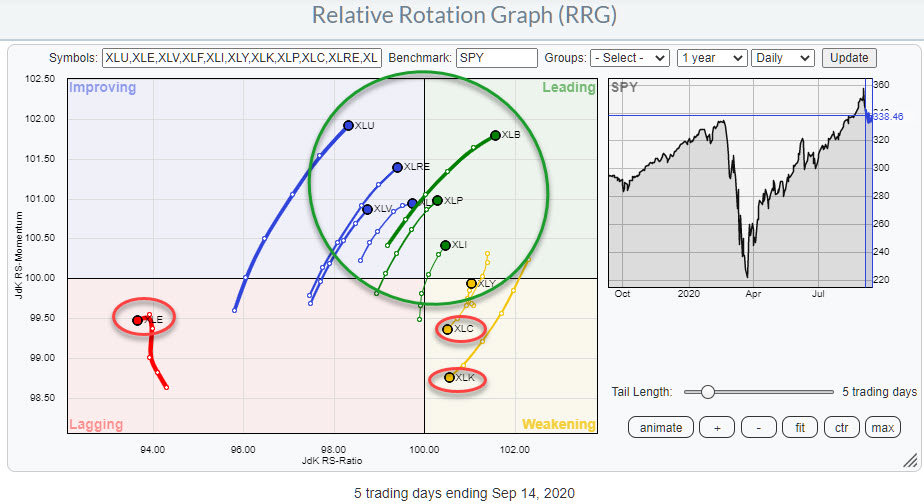
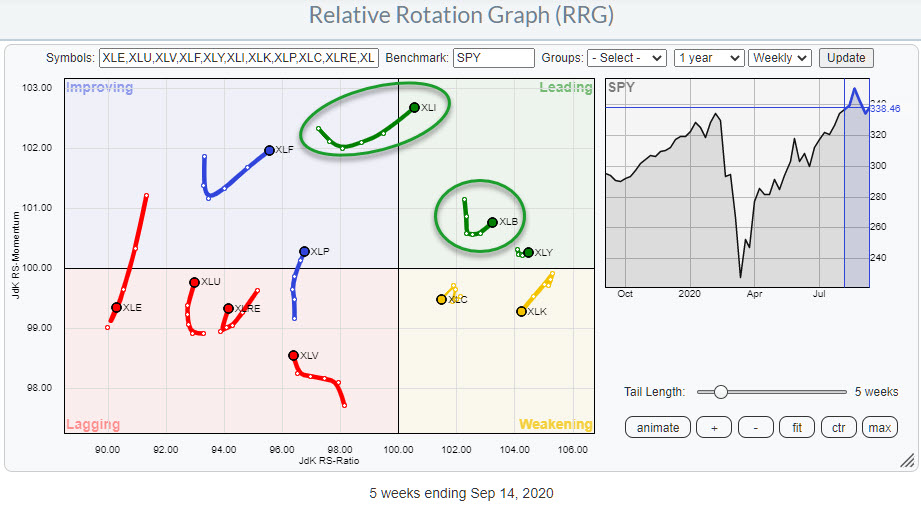
Last week, the rotations for the Communication Services and Technology sectors continued on their trajectory deeper into the weakening quadrant, heading towards lagging. As always with relative strength, one sector's loss is another sector's gain - or, in this case three sectors' losses are the remaining sectors' gains.
The table below shows the 5-day performance of the sectors in the RRG above.
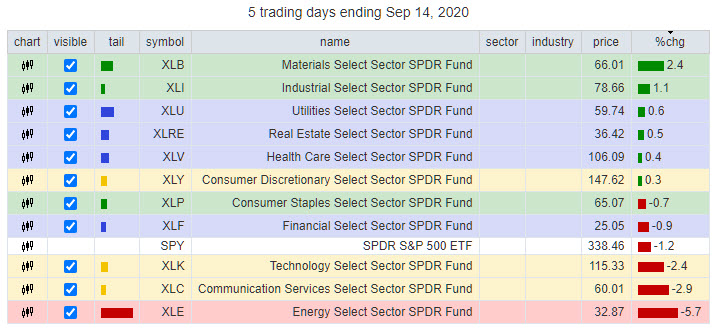
Over this period, SPY lost 1.2%. There were three sectors underperforming SPY - Technology -2.4%, Communication Services -2.9% and Energy with a whopping 5.7% loss.
Energy
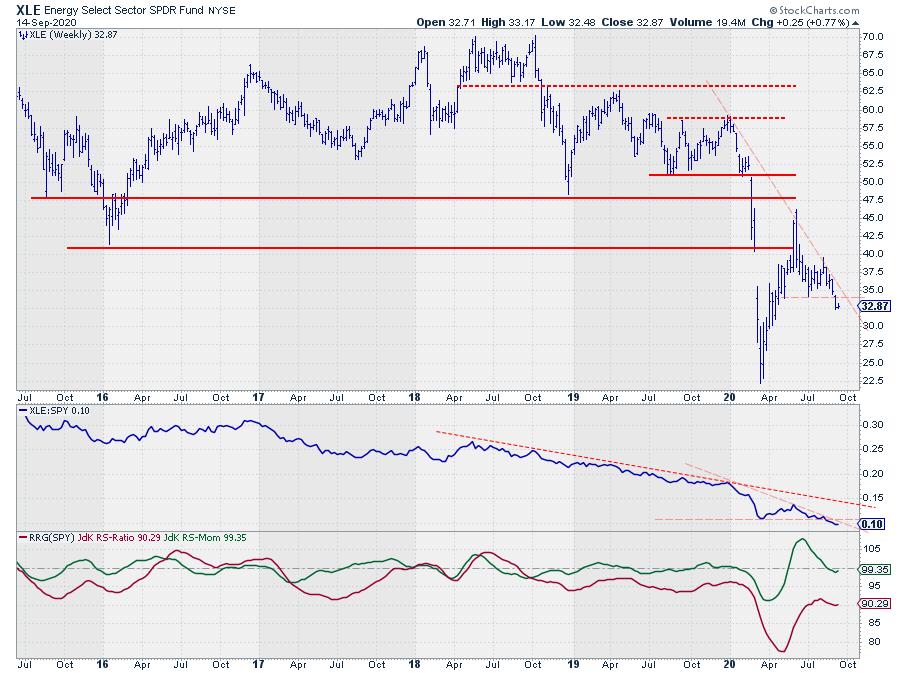
Positioned far to the left inside the lagging quadrant on both the daily and the weekly Relative Rotation Graphs, Energy remains the sector to avoid from a relative perspective.
The recent price action has ended the up-move out of the March low. Last week's decline below the previous low has started a new series of lower highs and lower lows, which makes energy a sector in a downtrend on both relative and price charts.
Technology & Communication Services
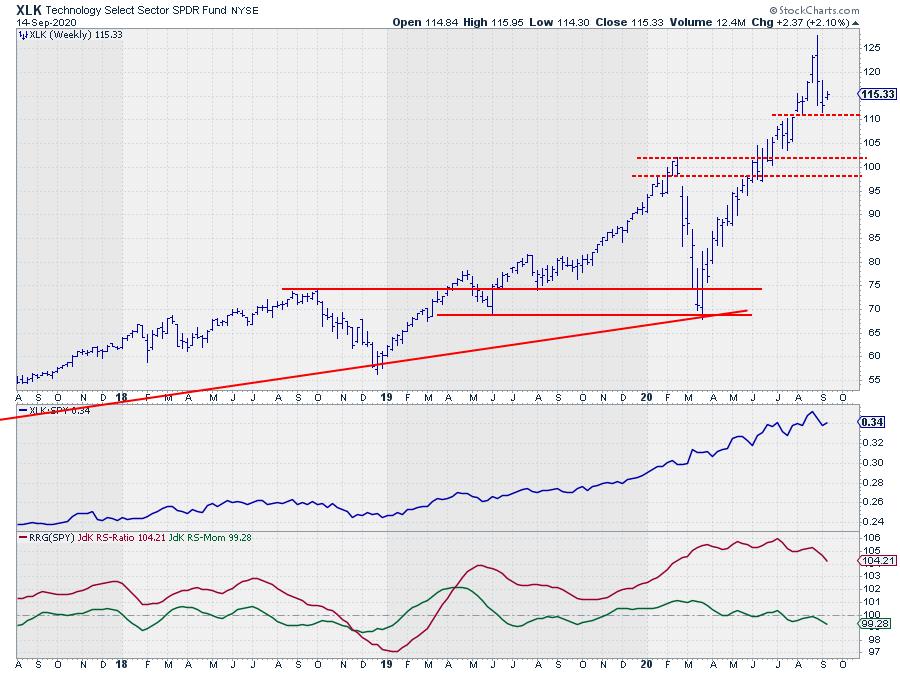
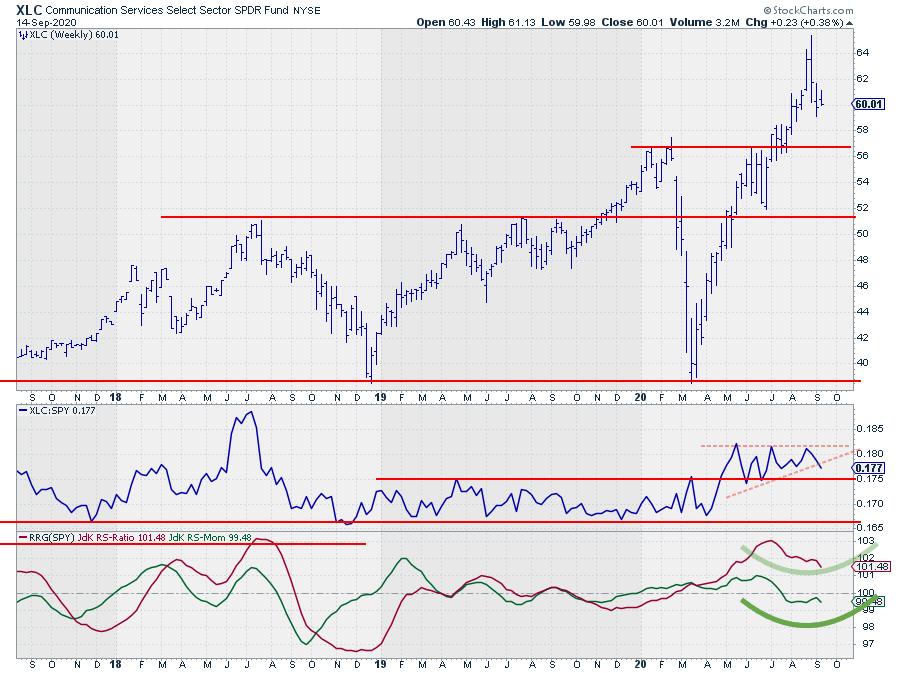
Both sectors were hit hard in the last two weeks, bringing prices down around 10% off their recently reached highs. Although it seems much it is not much when compared to the gains for both sectors since their March lows, with huge trends come strong corrections and, for now, the declines in both these sectors have to be seen as just that, a correction. Until evidence mounts that it may actually be a turnaround, that will be the base scenario.
On the price charts above, you can see that both Tech and Comm have plenty of room to wiggle before previous lows will get broken, which will be the first sign for a trend reversal. We are not there yet.
A more-or-less similar situation goes for the relative strength of both sectors. The strong upward trend in Tech vs. SPY since early 2019 and the recent break out of a range for Comm Svcs are positive. The short term counter-move is not strong enough yet to reverse those existing longer-term relative trends and outlook... YET!!
Some Lose, Some Win
The result of the setback in XLK and XLC, XLE is in a very clear downtrend and that has not changed, causing some other sectors to pick up the pace as they welcomed money rotating out of these two sectors.
Looking at the RRG at the top of the article, XLB and XLI are the biggest winners at the moment. Both are rotating into the leading quadrant (daily RRG) at strong RRG-headings.
Materials
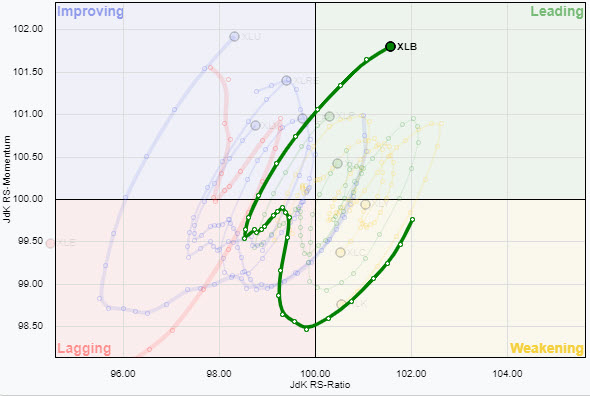
On the weekly RRG, materials was already located inside the leading quadrant, but started to lose a bit of momentum. The recent improvement in relative strength has turned that around and XLB is now heading in the right direction again.
The small chart to the right shows the daily tail of XLB in isolation. It is very visible that the "hook" on the weekly RRG is actually a nice clockwise rotation on the daily RRG.
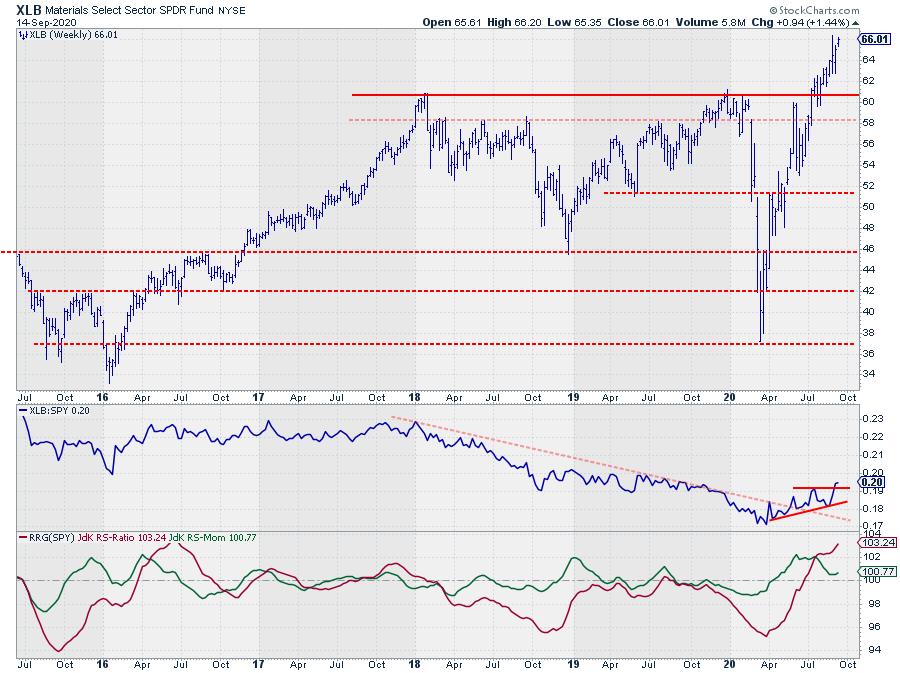
The price chart for XLB shows a continuation of the rally after the break to new highs, which is confirmed by a break above its prior high in the RS-line.
Industrials
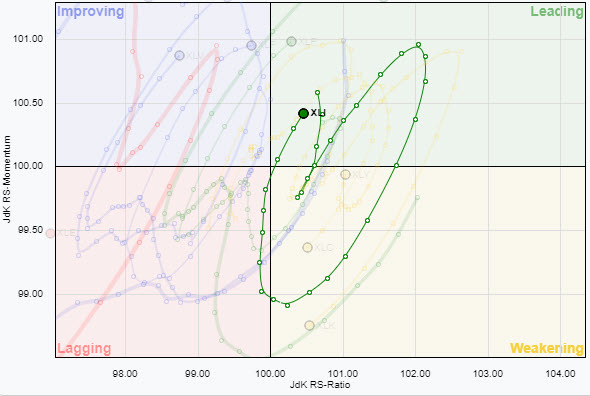 XLI, the industrials sector, also shows a "hook," but this one occurred inside the improving quadrant, where XLI changed its course back towards the leading quadrant after initially rolling over.
Just like XLB, the small chart to the left shows the clockwise rotation for XLI on a daily basis, while the weekly RRG shows a hook. This type of behavior is very common when a sector goes through a swift change of (relative) direction.

Industrials is one of the sectors in the S&P 500 which has not yet reached new all-time-highs. However, the structure of higher highs and higher lows in the price chart is pointing to strength.
With both RRG-Lines now back above 100, and thus XLI inside the leading quadrant, it is likely that the sideways/bottoming formation in the RS-line will resolve to the upside in coming weeks.
#StaySafe, --Julius
Julius de Kempenaer
Senior Technical Analyst, StockCharts.com
Creator, Relative Rotation Graphs
Founder, RRG Research
Host of: Sector Spotlight
Please find my handles for social media channels under the Bio below.
Feedback, comments or questions are welcome at Juliusdk@stockcharts.com. I cannot promise to respond to each and every message, but I will certainly read them and, where reasonably possible, use the feedback and comments or answer questions.
To discuss RRG with me on S.C.A.N., tag me using the handle Julius_RRG.
RRG, Relative Rotation Graphs, JdK RS-Ratio, and JdK RS-Momentum are registered trademarks of RRG Research.


