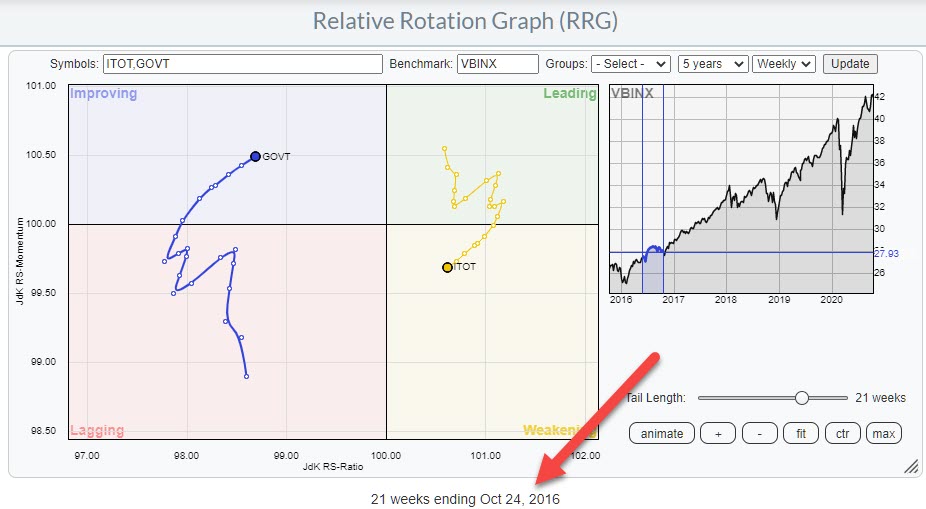
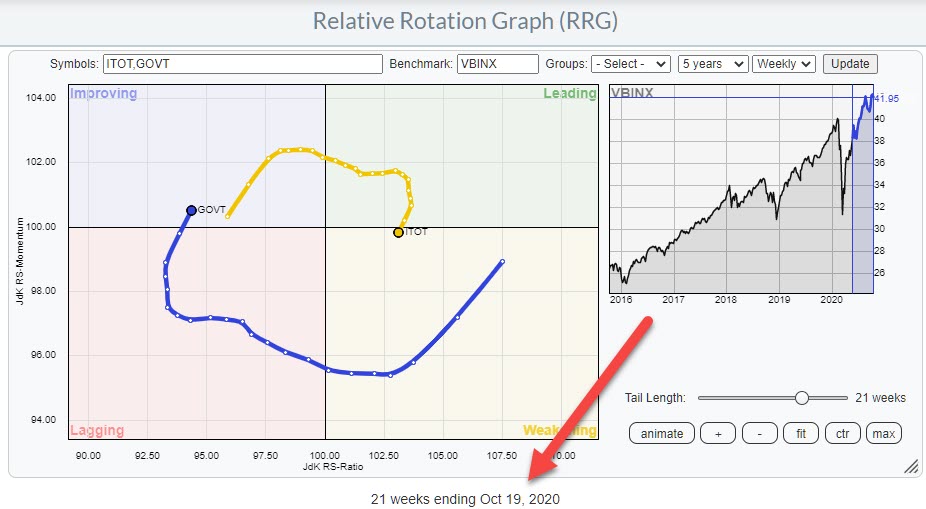
We are approaching the month of November, which, this year, also means election month. In last week's edition of the ChartWatchers Newsletter, I wrote an article. Presidential Rotation, on how the rotations for Stocks vs. Bonds are now looking similar to the rotation seen around the same time in 2016.
Here are the two Relative Rotation Graphs for reference. You can click on the link above to read the full article.
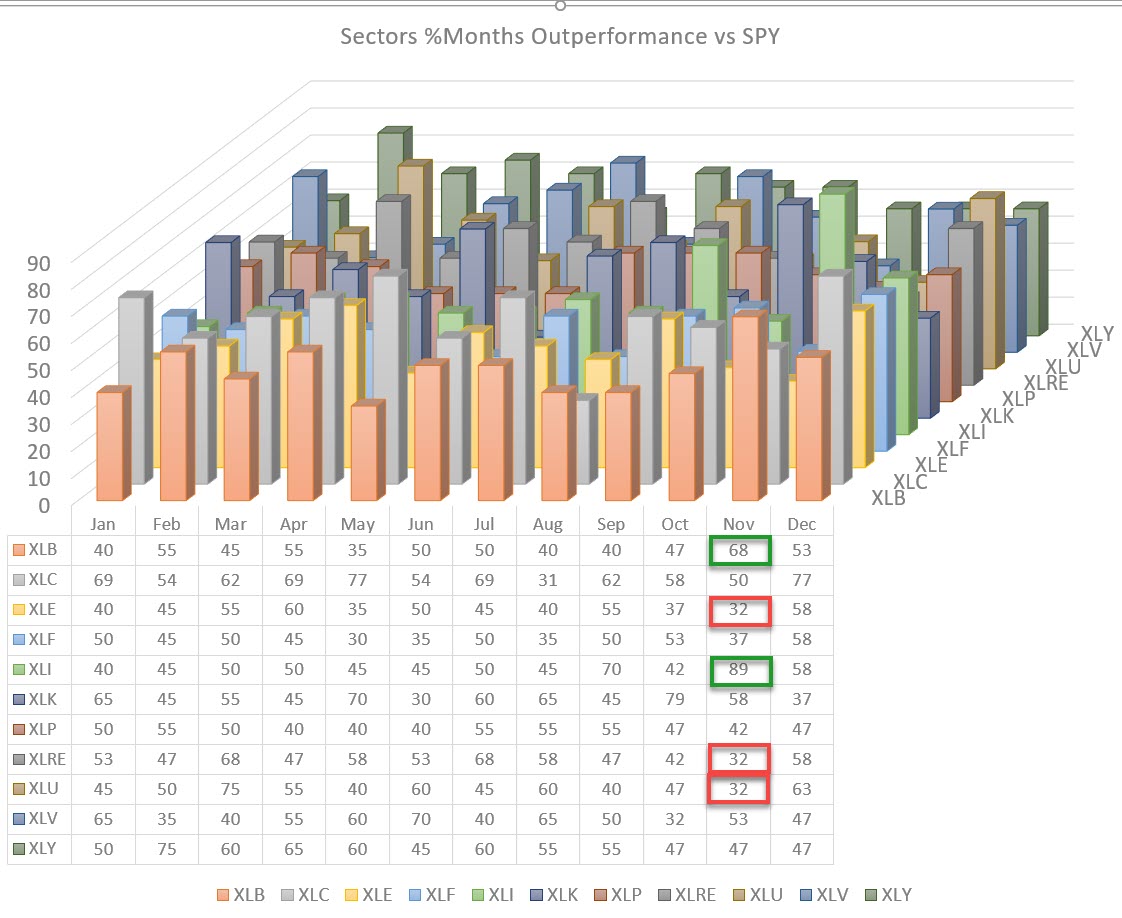
The graph at the top of the article is showing the historical out-/underperformance per sector versus the S&P over the last 20 years (where data available). Digging into the data reveals that November is actually the month with the biggest dispersion in the expected seasonal effects. The Industrials sector, at 89%, is actually showing the highest percentage outperforming months for the entire graph/table. But XLE, XLRE and XLU, at 32%, are close to the lowest percentage seen for this universe.
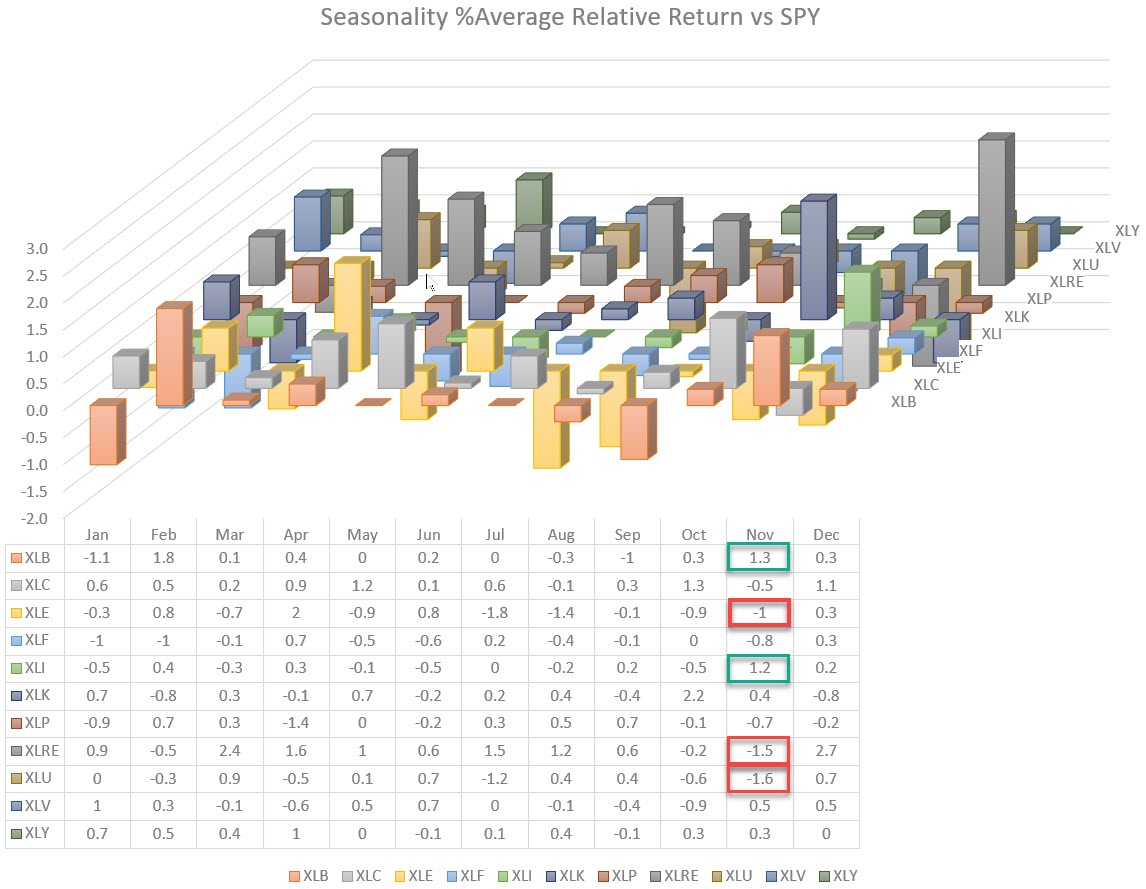
The expected relative returns vs. SPY are graphed similarly in the image below.
The Relative Rotation Graph below shows the weekly rotations for the five sectors that are likely to out- or underperform in November based on their historical seasonality.

Energy

The easiest one to analyze is the Energy sector. Based on seasonality, the sector is expected to underperform SPY. Historically, XLE underperformed SPY 68% of the time. And the expected underperformance is 1% (below SPY).
Looking at the chart, that seems a likely scenario. The price continues to decline sharply and remains below the steeply declining resistance line. Similar behavior is seen in the RS-line, which is still in its long term downtrend; in addition, the shorter, steeper, falling resistance is still in play, pushing both RRG-Lines well below 100 and the XLE tail deeper into the lagging quadrant.
Real Estate

The Real Estate sector is showing a slightly different picture. On the weekly RRG, the tail is inside the improving quadrant and at a heading between 0-90 degrees, which in itself is positive. However, the declining RRG-velocity, the distance between the week-to-week observations, has declined rapidly recently, indicating that there is very little power left in this rotation.
A short tail, characterized by small distances between the observations, indicates indecisiveness and has higher odds of rotating back.
Looking at the raw RS-Line, this makes for a viable scenario, as RS just broke below its previous low. This leaves very little room for relative strength to move up, which will limit the possibility for RS-Momentum to move much higher before dropping back and rotating back below 100. The tail will then rotate back into the lagging quadrant and come in sync with the expected underperformance for November.
Utilities
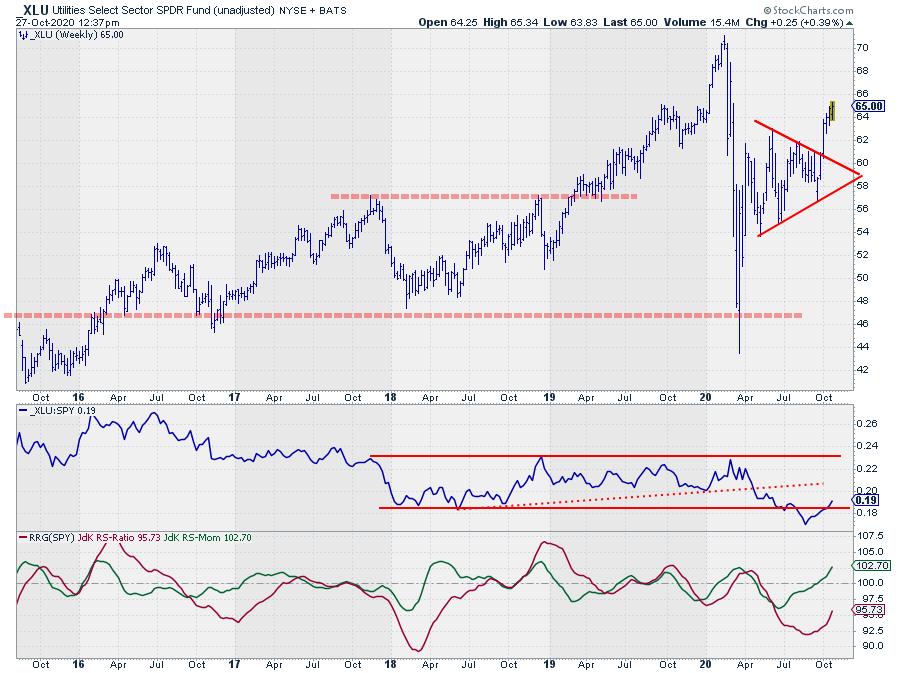
For the Utilities sector, the actual rotation is completely disconnected from the weak outlook based on seasonality.
The sector recently broke out of a large symmetrical triangle and is working its way higher, while the relative strength line vs SPY managed to get back into the trading range from which it broke lower a few weeks ago. Such a move often leads to a test of the upper boundary of that old range.
The RRG-Lines, which are pushing XLU towards the leading quadrant, while inside improving are pointing to outperformance in coming weeks.
If such a disconnect happens, it is wisest, imho, to pass on any seasonality based trades/positions for this sector.
Materials
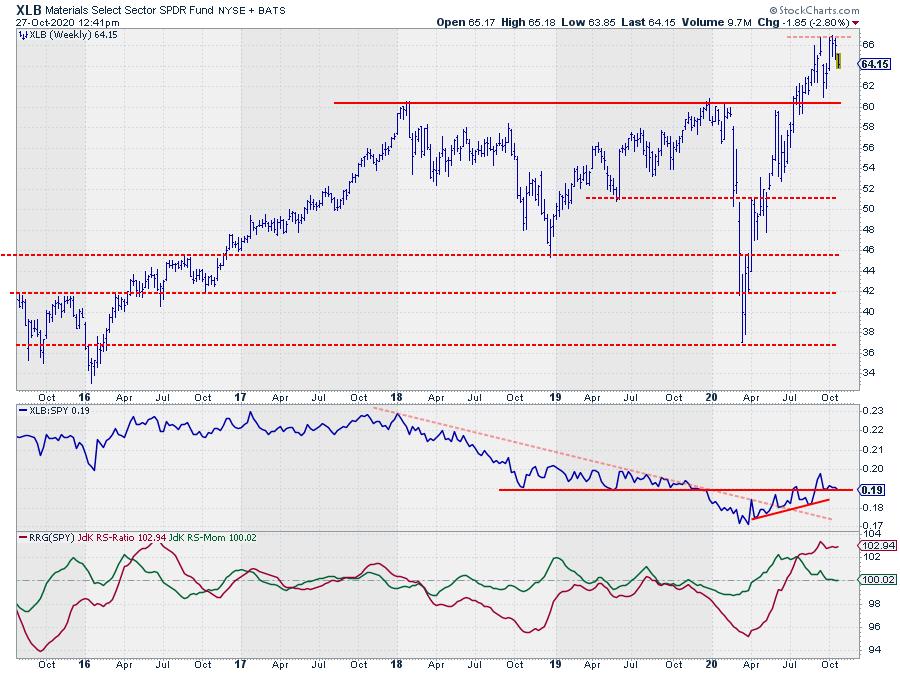
 The price chart for XLB is holding up well above the former horizontal resistance level, which was broken in July and is now acting as support. From a price perspective, that level around $60 is now important. A break lower would mean the completion of a double top pattern and, very likely, an acceleration in the decline after that break. As long as it holds up, things remain positive, and a push beyond $67 would be a nice confirmation.
The expected outperformance is based on the relative performance vs. SPY and, looking at the raw RS-line plotted below the chart, we can see that the downtrend that was in play since early 2018 has now been broken, with a fresh series of higher (relative) highs and lows now emerging.
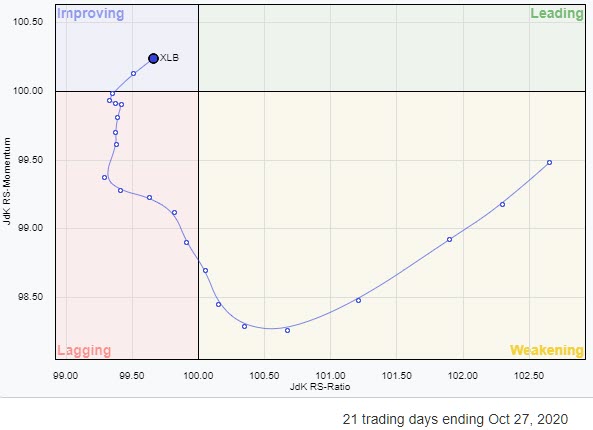
The decline in relative momentum has caused the tail to roll over inside the leading quadrant, but, just like the declining RRG-velocity on the XLRE tail, we see a similar pattern on the XLB tail. In this case, however, it is at the right side of the RRG, which increases the odds for a turn back up.
The daily RRG on the inset shows the daily rotation for XLB, which has already started to push back towards the leading quadrant.
Based on the average historical performance, an outperformance of 1.3% over SPY is expected.
Industrials
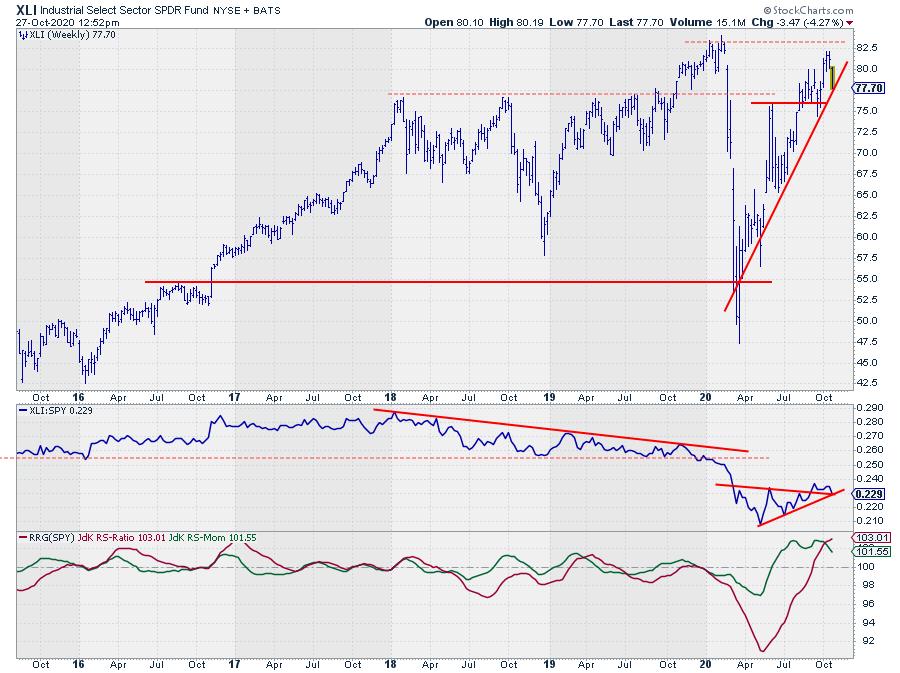
The strongest seasonal call for this month is for the Industrials sector. Historically, XLI has outperformed SPY 89% of the time, with an average return of 1.2% over SPY.
On the weekly RRG, the XLI tail has also rolled over inside the leading quadrant, losing some relative momentum recently. This is following the sideways move in RS after the recent break from the bottom formation, which could be marking a turnaround from the LT-downtrend.
The daily RRG on the small chart shows the daily rotation, which supports a further improvement in relative strength in the near term.
I will be watching for XLI to hold the rising support line on the price chart and potential break to new highs above the early 2020 peak, combined with a continuing improvement in relative strength turning the weekly tail back into a 0-90 degree heading.
#StaySafe, --Julius
Julius de Kempenaer
Senior Technical Analyst, StockCharts.com
Creator, Relative Rotation Graphs
Founder, RRG Research
Host of: Sector Spotlight
Please find my handles for social media channels under the Bio below.
Feedback, comments or questions are welcome at Juliusdk@stockcharts.com. I cannot promise to respond to each and every message, but I will certainly read them and, where reasonably possible, use the feedback and comments or answer questions.
To discuss RRG with me on S.C.A.N., tag me using the handle Julius_RRG.
RRG, Relative Rotation Graphs, JdK RS-Ratio, and JdK RS-Momentum are registered trademarks of RRG Research.


