Asset Classes
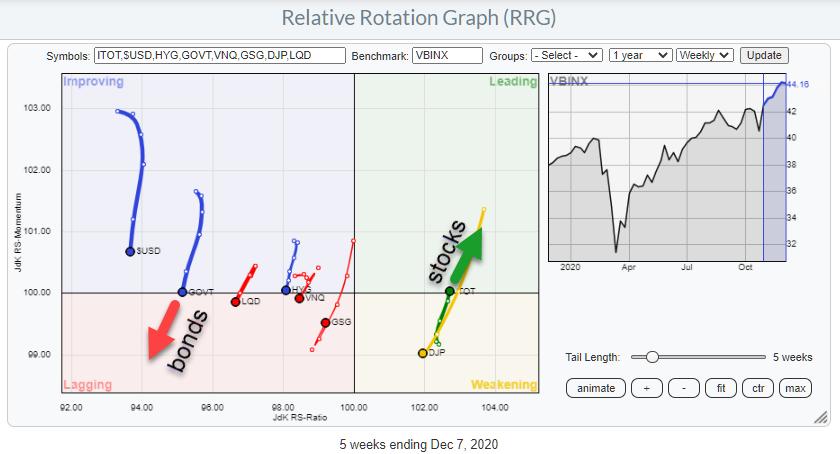
Starting at Asset Class level, the first Relative Rotation Graph shows the rotation of various asset classes (ETFs) against VBINX (the benchmark).
The relationship that stands out here is the very clear preference for stocks. It is the only tail that is inside the leading quadrant. As an added positive the ITOT tail returned into the leading quadrant after a rotation from leading through weakening and now back into leading, without hitting the lagging quadrant. Usually that is a strong sign as it signals a new upward leg in an already rising, relative, trend.
The picture for bonds is the reverse as the GOVT tail has rotated through improving but is now rotating back into lagging without having hit the leading quadrant.
GOVT but also IEF (the 7-10 year treasuries) are very close to breaking below support on the price chart.
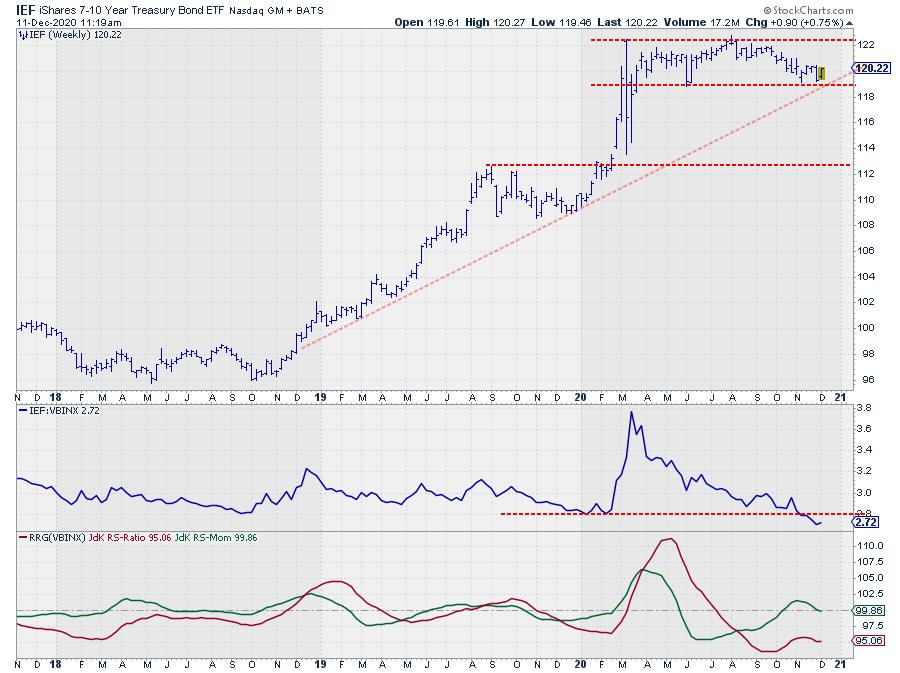
For IEF the support level that I am watching is around $ 119 where horizontal support is meeting the rising support line. When those levels give way an acceleration lower for bonds (rising yields) may be expected which will add even more fuel to the stock/bond ratio!
Stock Sectors
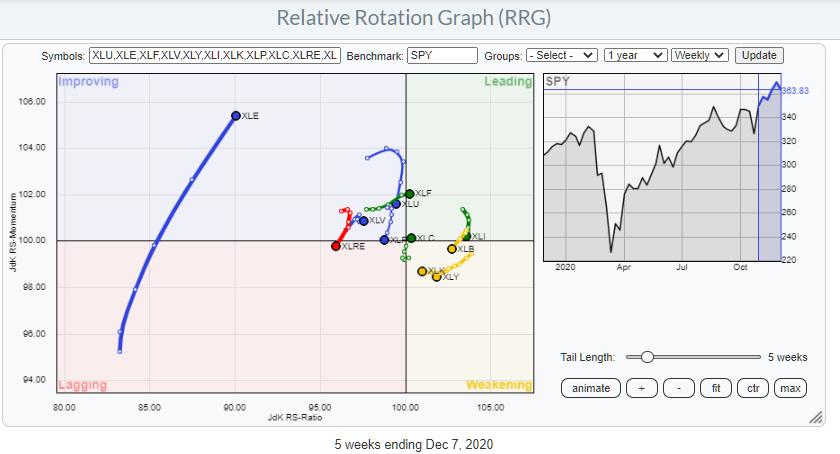
The second RRG shows the rotation of all S&P sectors vs SPY.
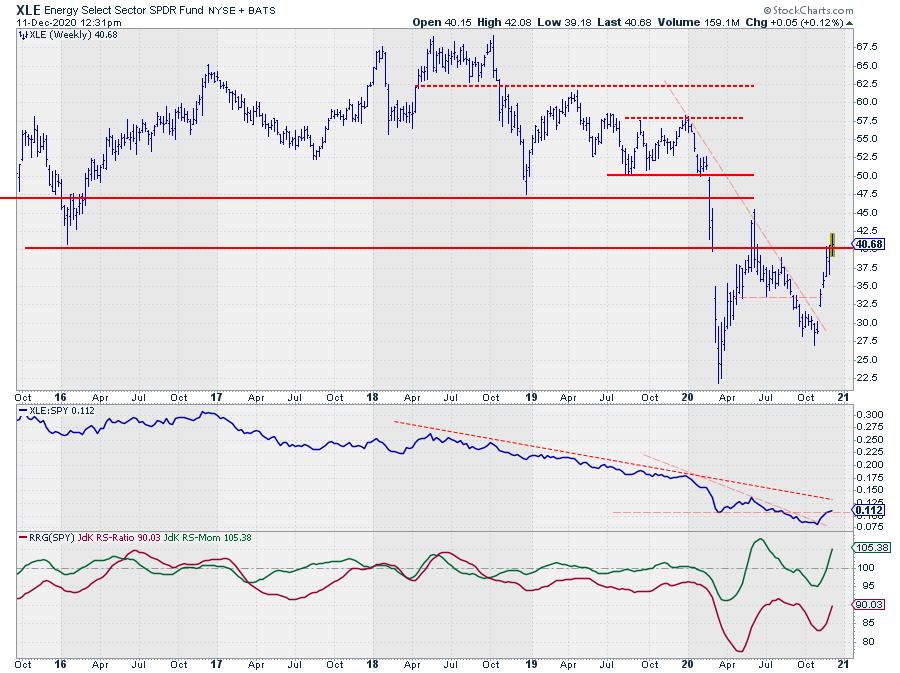
The one tail that really stands out is XLE, very far to the left and high up inside the improving quadrant. Technically still in a relative downtrend but going through a high momentum upswing.
Energy
Two sectors are interesting to monitor from a positive perspective, these are XLF (Financials) and XLC (Communication Services)
Both sectors are (re-) entering the leading quadrant.
Financials
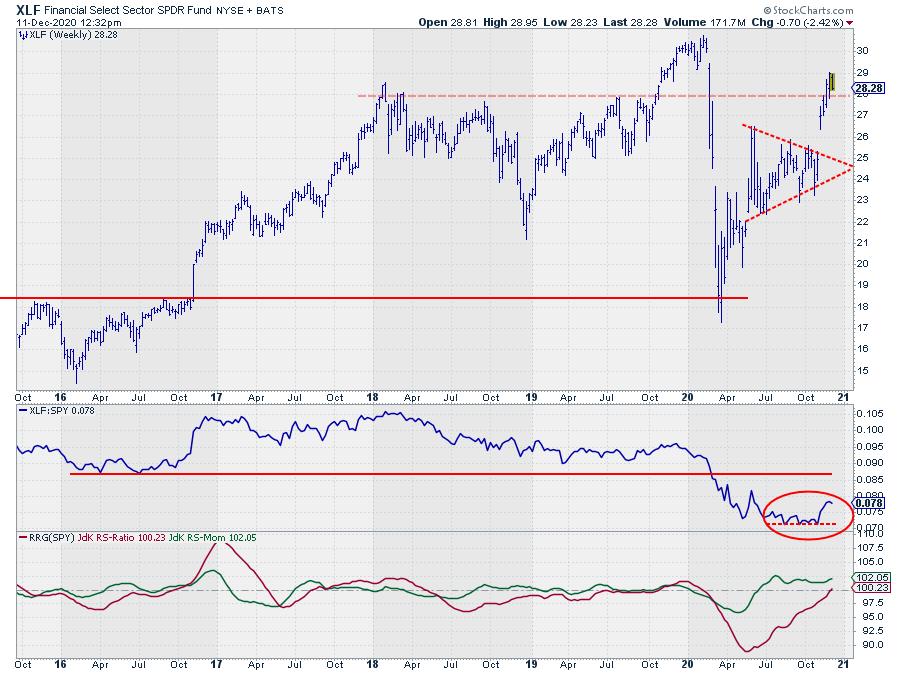
The upward break from the symmetrical triangle on the price chart helped the relative strength line of XLF vs SPY to bounce of horizontal support. Subsequently XLF managed to take out another horizontal level around $ 28 and hold up above that level.
These are definitely positive elements to keep an eye on. With the RRG-Lines now both above 100 and the tail, therefore, back into the leading quadrant Financials are now back as a leading sector.
Communication Services
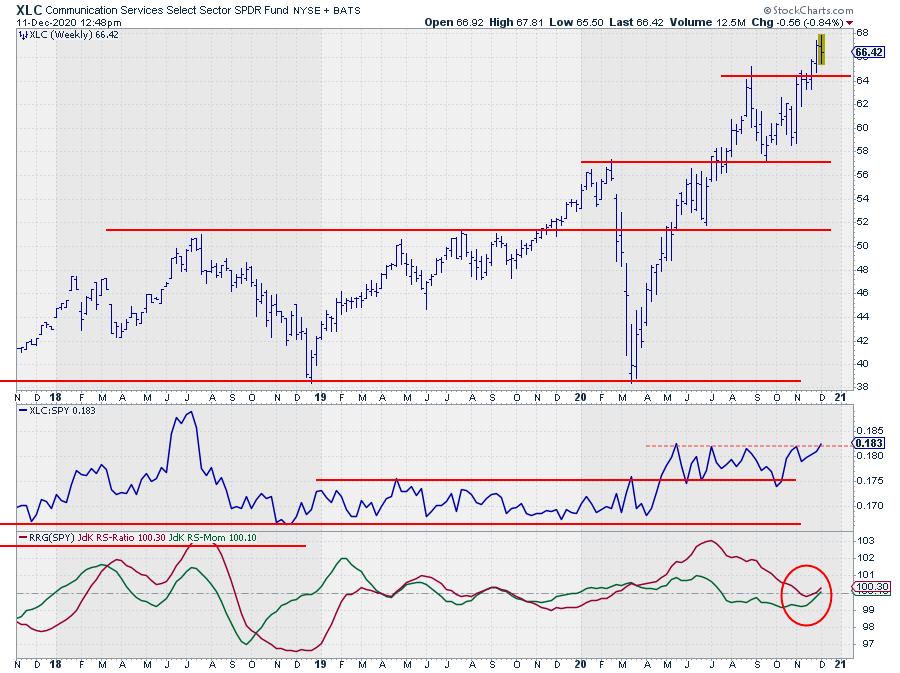
XLC is the sector that outperformed SPY 77% of the time in December over the last 20 years.
The sector broke to new highs three weeks ago and has held up well above that breakout level since that break. This helps the relative strength line which seems to be about to break its horizontal resistance level which is causing both RRG-Lines to curl up and come back above the 100-level again.
Coming into the leading quadrant from weakening is usually a reliable signal as it means that a new up-leg in an already rising trend is about to start.
Growth-Value-Size
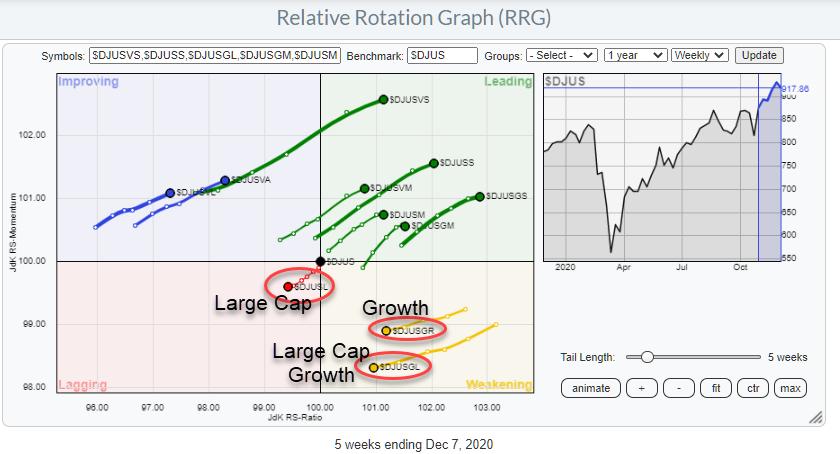
The third RRG show the relationship between growth and value, large-, mid-, and small-caps, and also the combinations of these two breakdowns.
The signal that this RRG sends is very clear; there is only one segment of the market that you need to avoid... and that is "Large-Cap Growth". All other segments of the market are on a positive trajectory vs the DJ Global index.
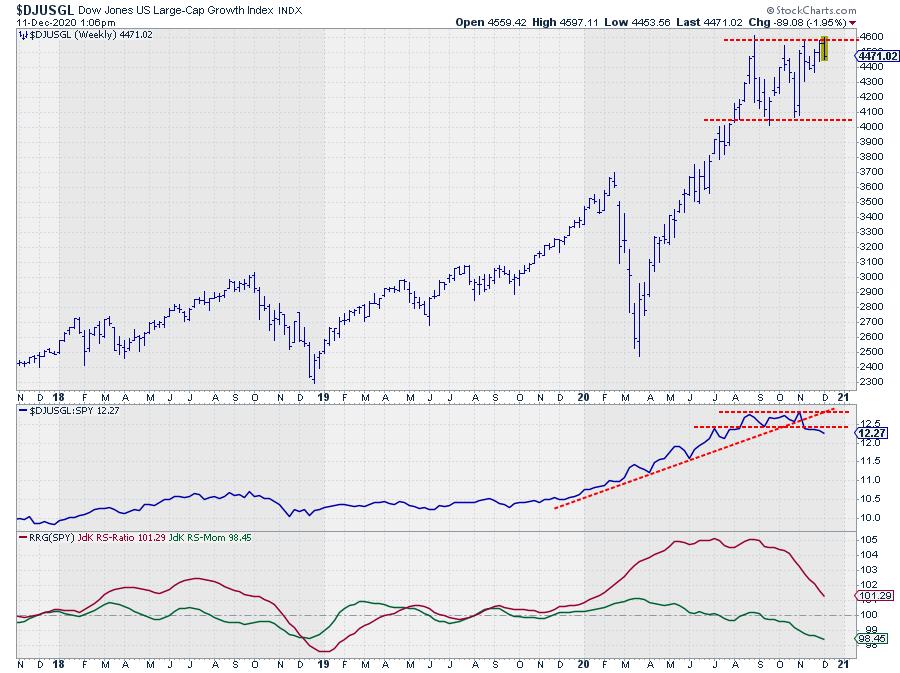
On the chart above, the struggle to move higher is clearly visible for $DJUSGL. The peak was reached in August and this index has not been able to push higher since.
The relative weakness is screaming off the the RS-Line and the RRG-Lines. The rising support line that marked the accelerating upward trend for Large-Cap growth stocks since the start of the year is now clearly broken and a double top was completed.
This is sending the RRG-Lines lower and a crossover of the RS0Ratio line below 100 only seems a matter of time.
Bonds
The RRG showing the rotations for various asset classes already pretty clearly indicated a preference for stocks over bonds.
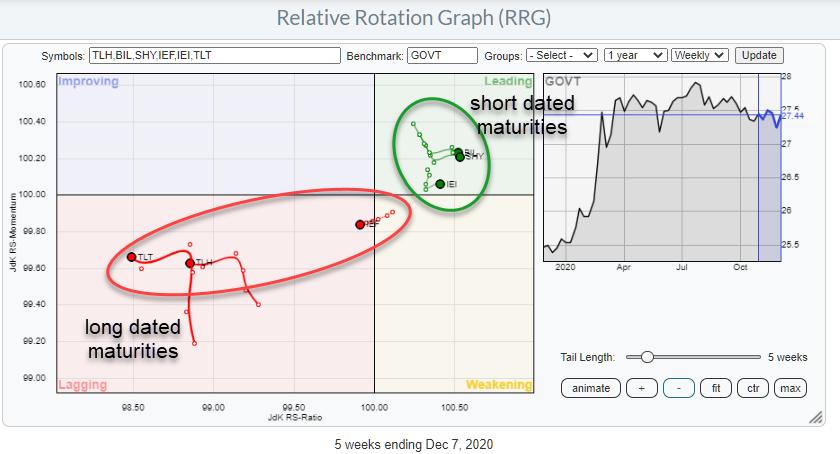
However when you still want to hold some exposure to bonds the RRG above showing the rotations for various bond maturities will be helpful to decide in which maturities to invest.
The current RRG for bond clearly shows a preference for shorter-dated bonds.
BIL, SHY, and IEI are all inside the leading quadrant and heading higher on the RS-Ratio scale. These ETFs cover 1-3 month to 3-7 year bond maturities. IEF, TLH, and TLT are all inside lagging and moving further into the lagging quadrant. These ETFs cover 7-10 year to 20+ year maturities.
The benchmark on this RRG is GOVT which covers ALL maturities and it is therefore the perfect benchmark to analyze the US yield curve/bond market.
Finally this rotation also clearly shows and indicates a further steepening of the curve ahead. Short maturities improving relatively (falling yield) while long maturities weakening further (rising yield) which results in a bigger yield difference difference between long- and short-dated bonds.
All in all, stocks are still the preferred asset class, within stocks the financials and communication services sectors are looking promising. For (government) bond holdings it is probably better to stick with shorter maturities.
#StaySafe, --Julius
Julius de Kempenaer
Senior Technical Analyst, StockCharts.com
Creator, Relative Rotation Graphs
Founder, RRG Research
Host of: Sector Spotlight
Please find my handles for social media channels under the Bio below.
Feedback, comments or questions are welcome at Juliusdk@stockcharts.com. I cannot promise to respond to each and every message, but I will certainly read them and, where reasonably possible, use the feedback and comments or answer questions.
To discuss RRG with me on S.C.A.N., tag me using the handle Julius_RRG.
RRG, Relative Rotation Graphs, JdK RS-Ratio, and JdK RS-Momentum are registered trademarks of RRG Research.


