Into the lagging quadrant on the RRG and to the short side of the RRG Long/Short baskets.
Before diving into the PG chart, let's go over the current symbols on both lists. At the moment, both the Long and the Short basket have six names in them.
Current LONG Basket
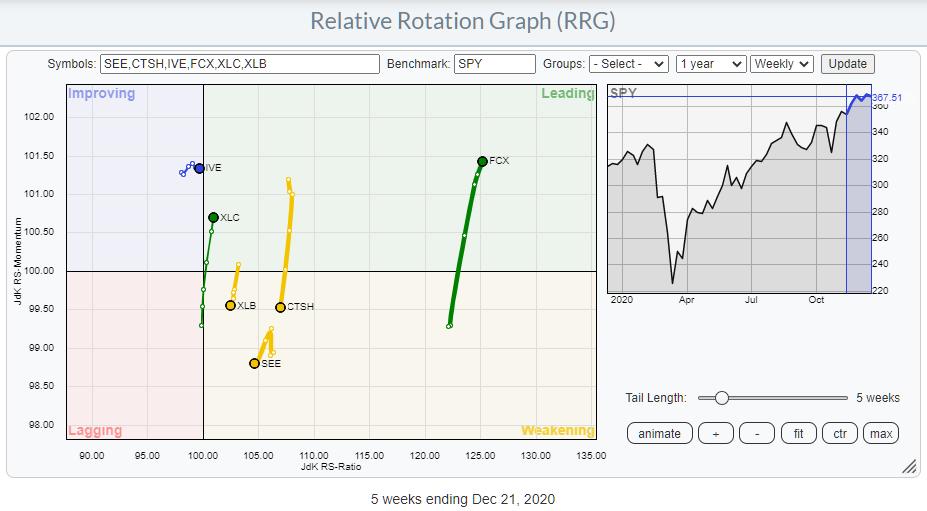
All six are (almost) all at the right hand side of the graph, which is what we would like to see from our long candidates.
IVE is almost crossing over into leading after traveling through improving. Recently, the tail has shrunk and is now very short while the pace is slowing down. I am going to monitor IVE a bit closer in coming weeks to see whether it will not roll over while still in improving or just into leading.
XLC and FCX are still looking good at strong RRG-Headings into leading.
All three symbols inside weakening are heading more or less South.
CTSH (+)
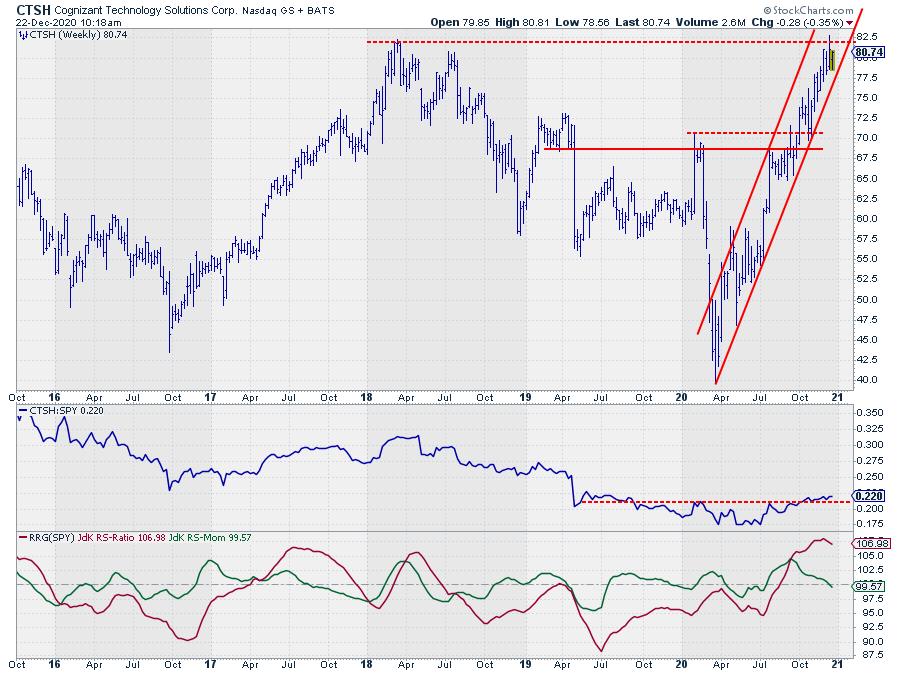
CTSH remains in its uptrend on both price and relative graphs. The big difference is that, on a relative basis, CTSH already broke its horizontal resistance while it is pushing against it in price terms. For now, the relative outlook remains good. A push to new highs will very likely trigger an acceleration higher.
XLB (+)
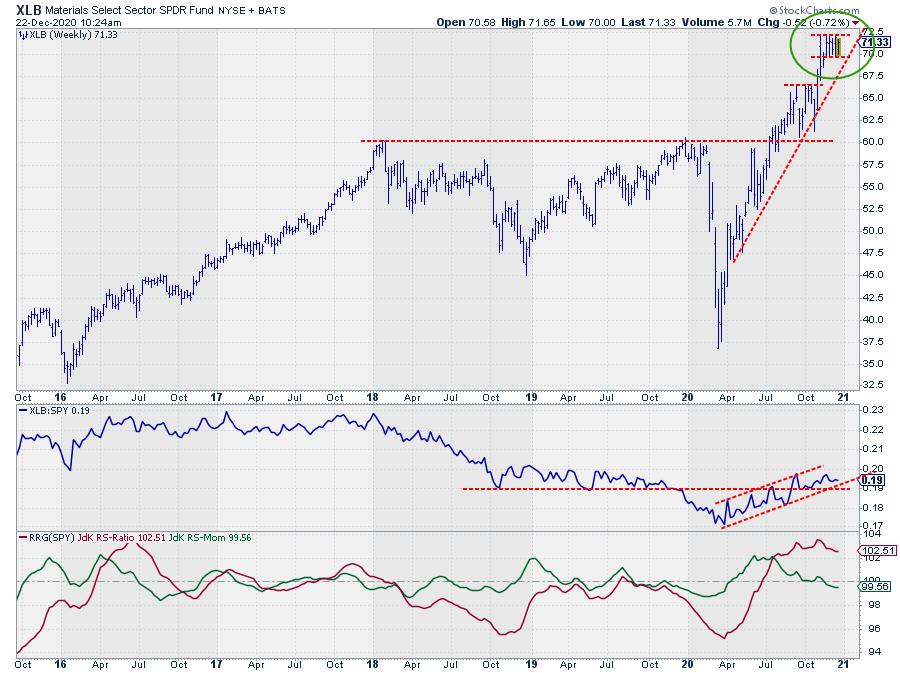
The materials sector continues to do well. Both the relative and the price chart show a gradually rising trend (channel). Over the last few weeks, XLB moved sideways in price terms, causing a slight loss of relative strength and -momentum. An upward break out of that consolidation area is expected to push XLB higher.
SEE (+)
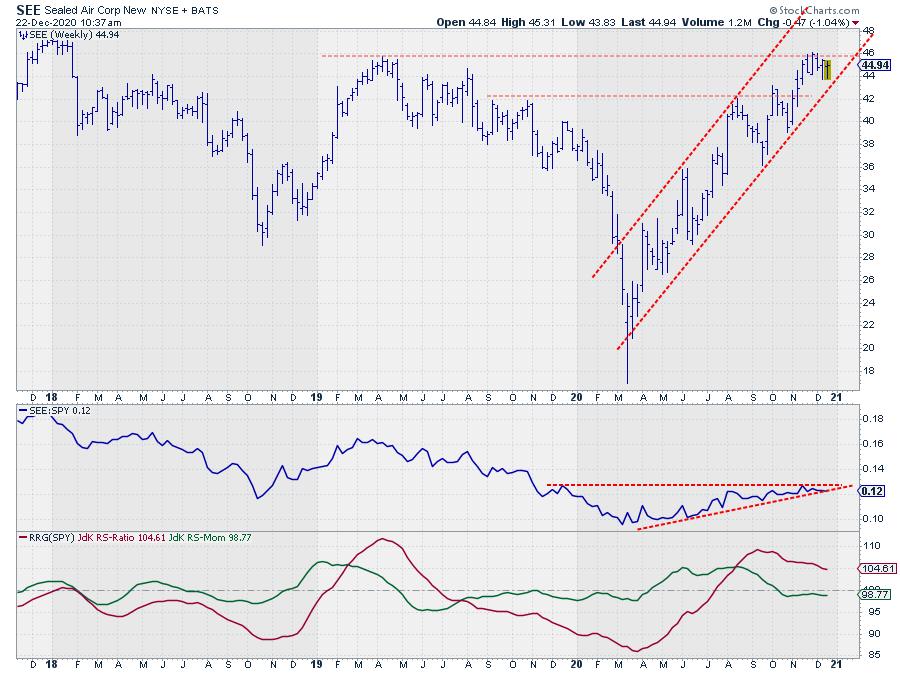
SEE is probably the weakest of all six symbols in the basket. It is pushing against overhead resistance on both price and relative graphs, causing the RRG-Lines to head lower. As the price channel and also the rising support line on the relative graph are still intact, I am keeping SEE on the list for now while looking for an upward breakout!
Current SHORT Basket
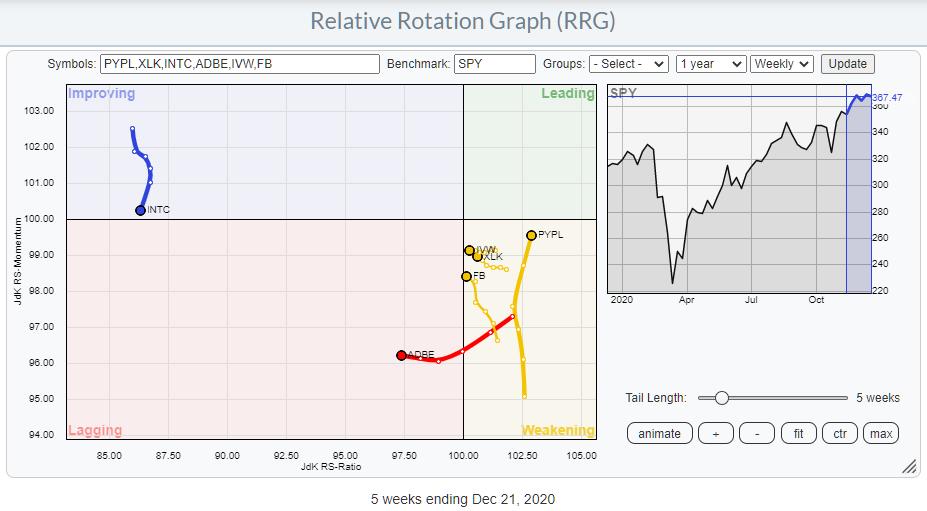
The RRG above shows the tails for the six names that are currently in the short basket.
INTC and ADBE are showing tails that need no further investigation. Both are clearly headed towards and inside the lagging quadrant.
FB is almost crossing over into lagging after a short period of recovering relative momentum, which warrants an extended stay in the short basket.
IVW remains as the counterpart of IVE in the Long basket.
PYPL (X)
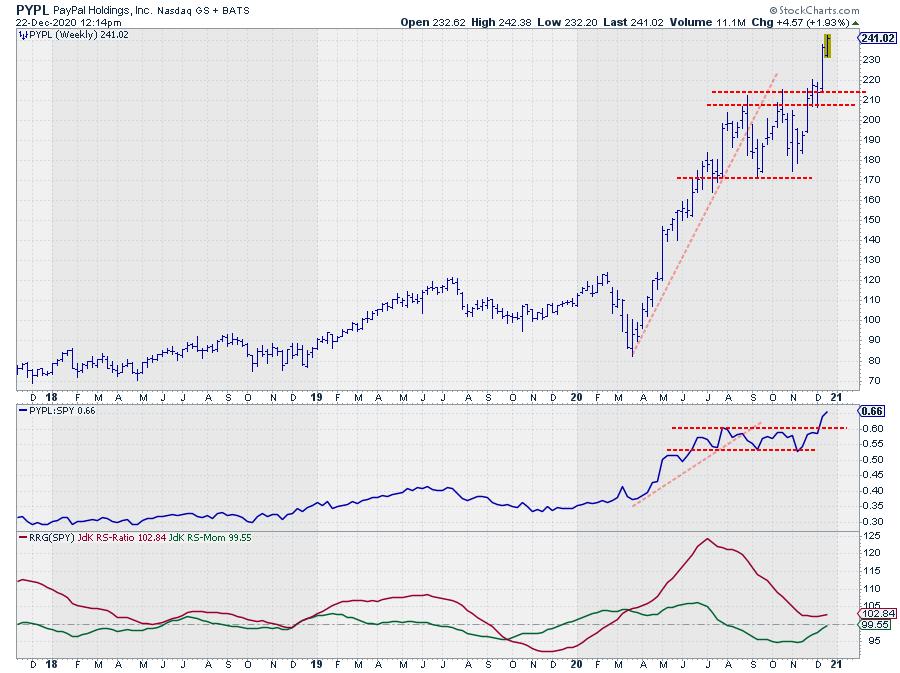
The short in PYPL never really started to work in our favor and now broke out to the upside in price and relative terms. Time to say goodbye and remove PYPL from the short basket.
XLK (X)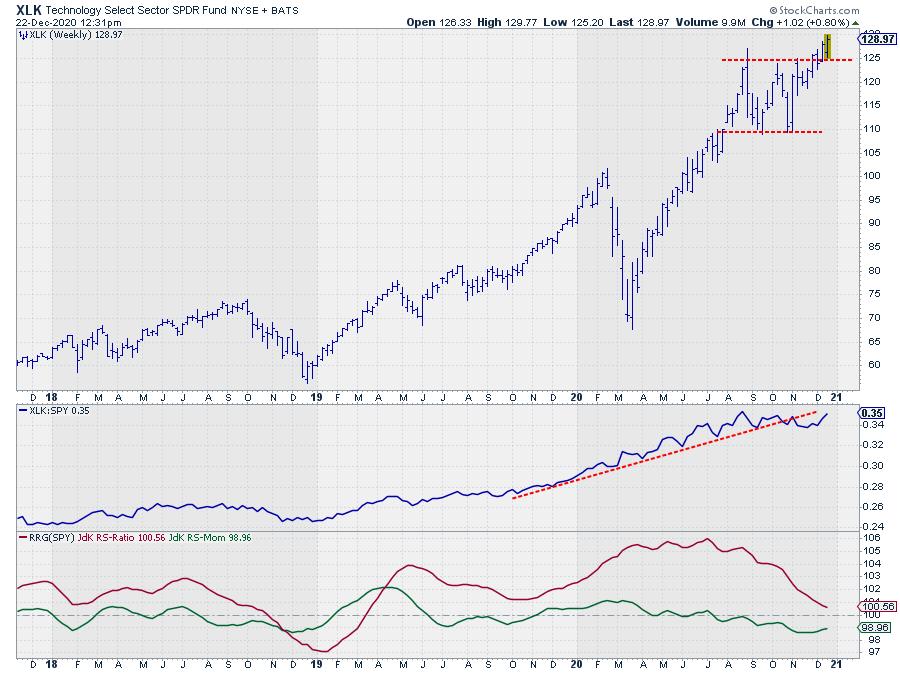
XLK was added to the list at the end of November, when I talked about the divergence between XLC and XLK in December. That position started well in the first half of the month, but recently XLK started to pick up again and is now actually outperforming XLC. Both are outperforming SPY!
With the break to new highs in XLK, the risk is getting too big for my appetite, so I'm taking XLK off the short basket.
New Shorts
With PYPL and XLK removed from the basketm we need two new short candidates to fill those gaps.
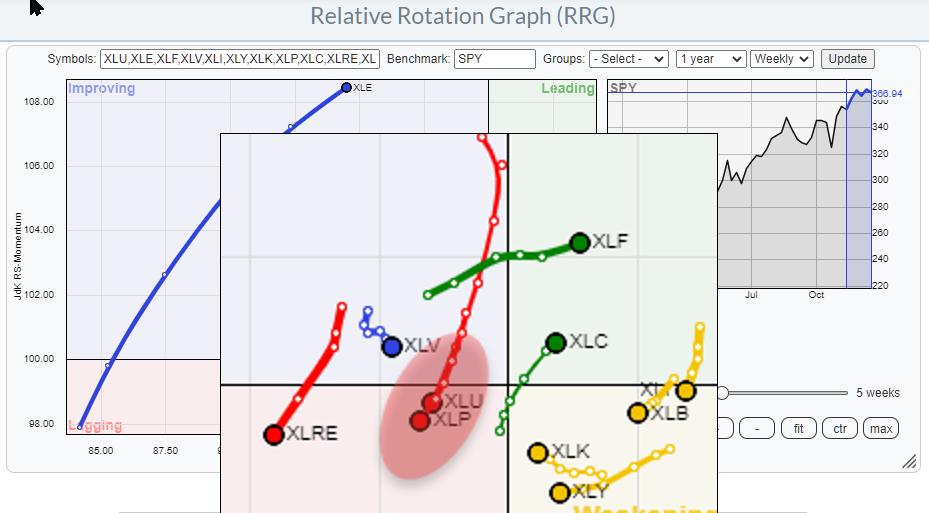
Looking at the current state of rotations in US sectors, three sectors are nose-diving back into the lagging quadrant after a stint through improving. Usually, that is not very good news for the relative performance of those sectors going forward.
As XLP and XLU have the longest, more powerful, tails of these three, I am going to search for short candidates in these two.
XLU
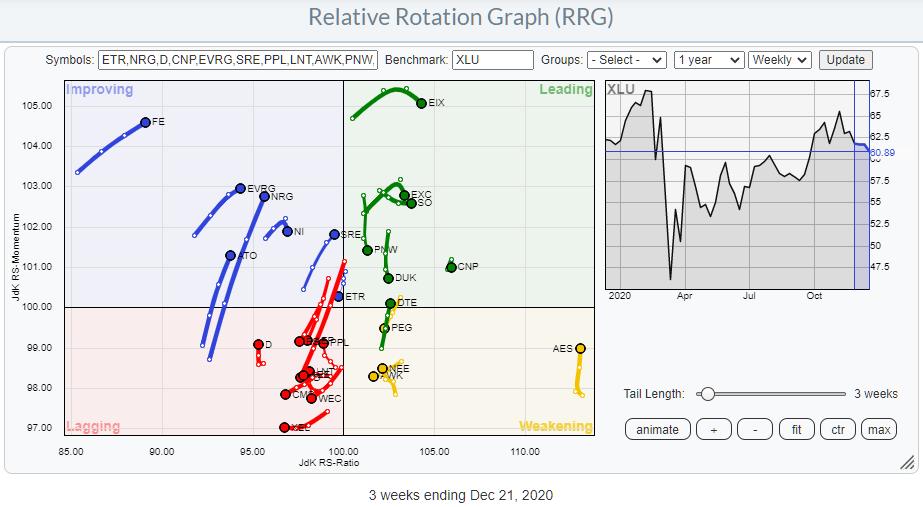
 Browsing through the tails of the stocks inside the Utilities sector, I noted three candidates that really stand out at the moment. These are ED, AEP and ETR.
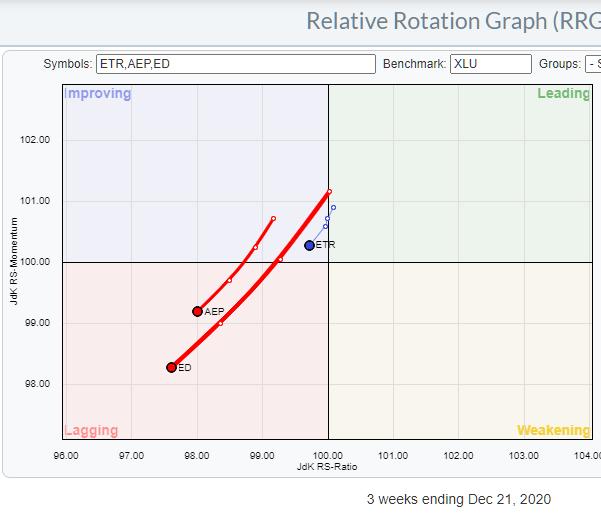
AEP and ED are already pushing deeper into the lagging quadrant, after having completed a rotation through improving. ETR has only just turned around, crossing over from improving into leading and then immediately turning back to improving and sharply heading towards lagging.
After reviewing all three charts, I decided to go with ETR.
ETR (-)
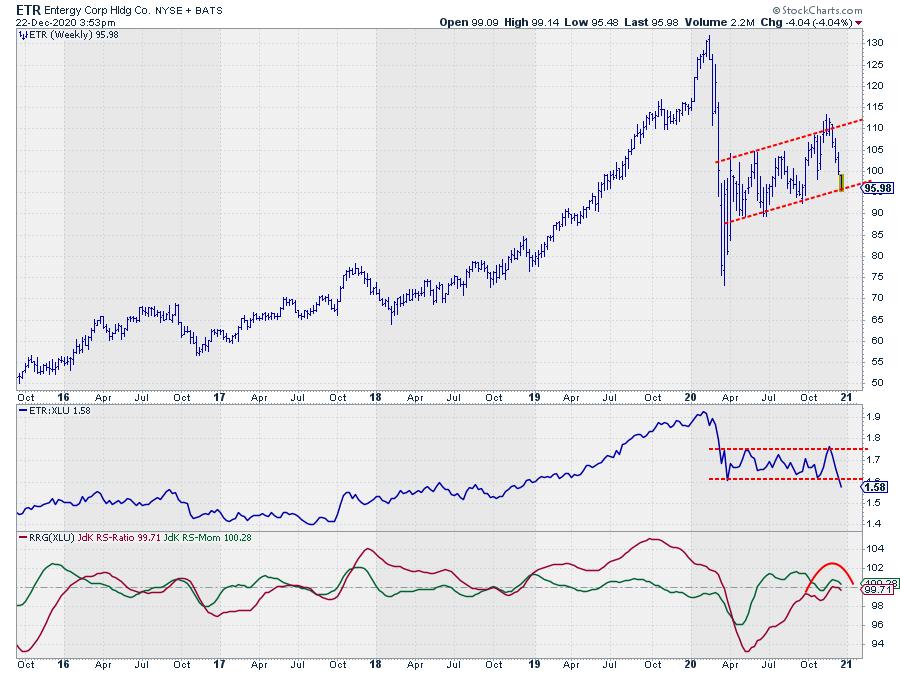
This stock failed at the breakout at the upper boundary of that slightly up-sloping range, then rapidly declined back to the lower boundary and is pushing to break lower.
On the relative chart, ETR is breaking down from that range as we speak, with both RRG-Lines rolling over and heading lower now. This gives ETR plenty of (relative) downside and only very limited upside potential. So I am adding ETR to the short basket.
XLP
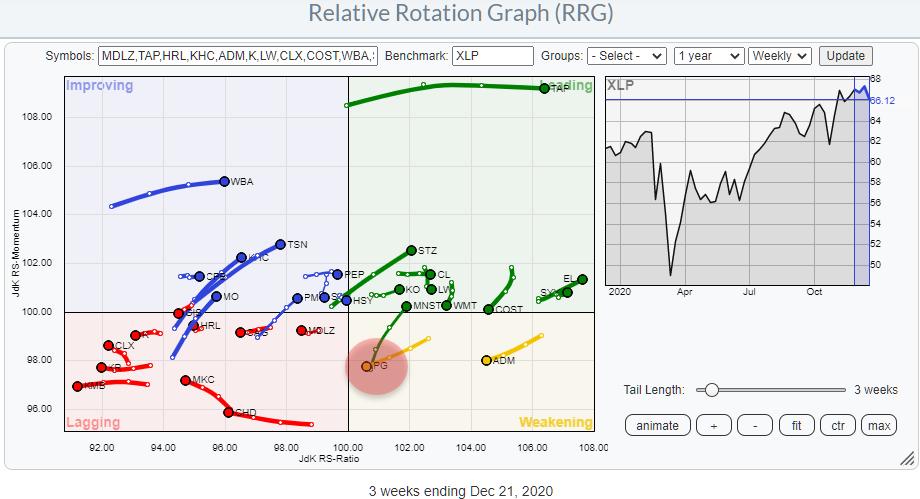
Looking at the RRG for Consumer Staples stocks in combination with their price charts, we have to conclude that pretty much all stocks inside lagging are (still) potential short candidates. But there is one name inside the weakening quadrant that had my attention. That name is PG, Procter and Gamble, the biggest weight in this sector at 17%, followed by KO (Coca-Cola) at a humble 10%.
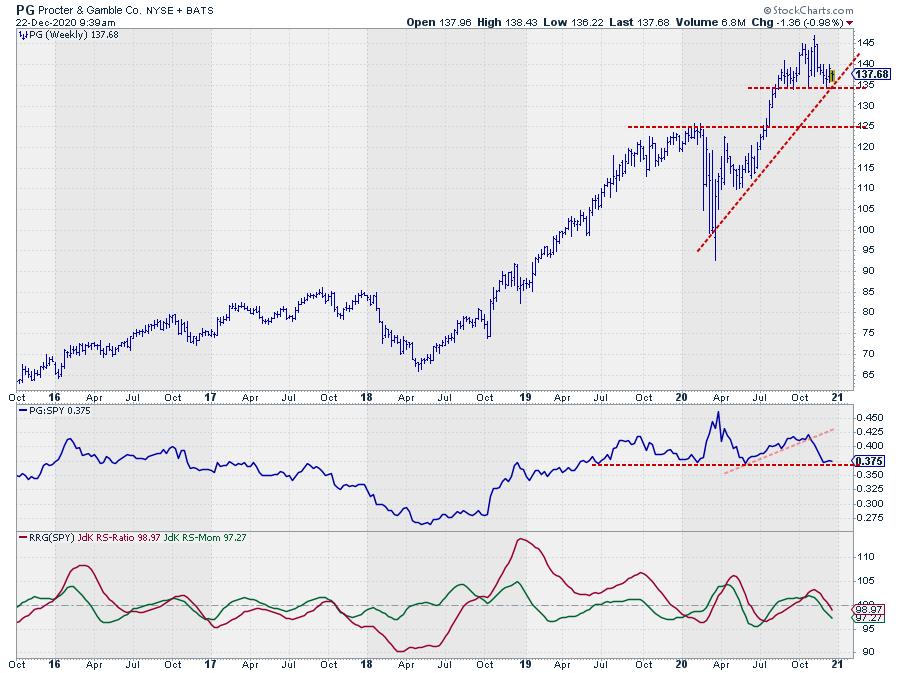
PG (-)
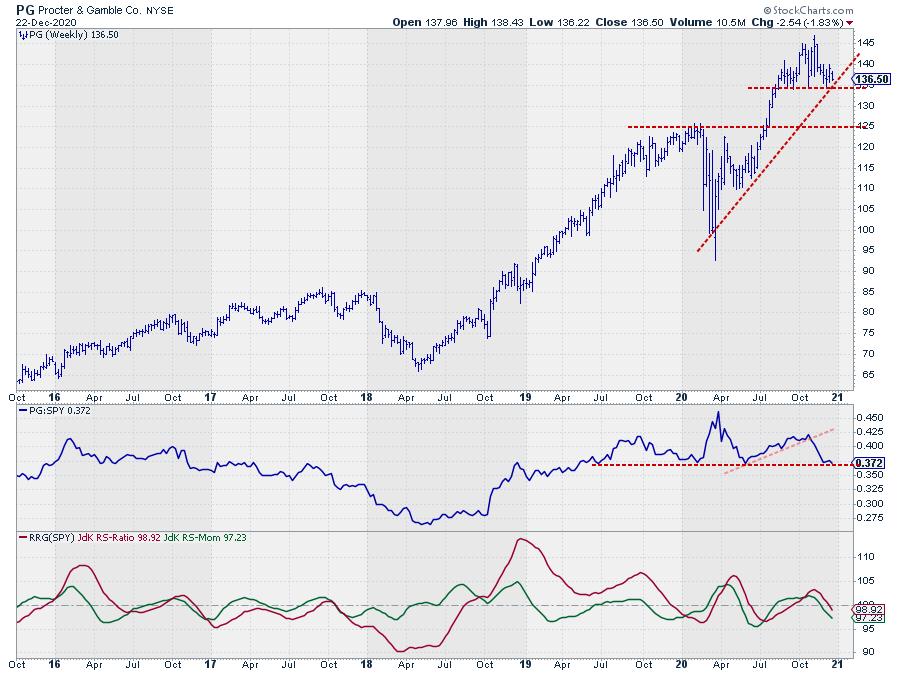
The relative strength for PG (vs. SPY) peaked in March of this year, and a new, lower, high was set at the end of October.
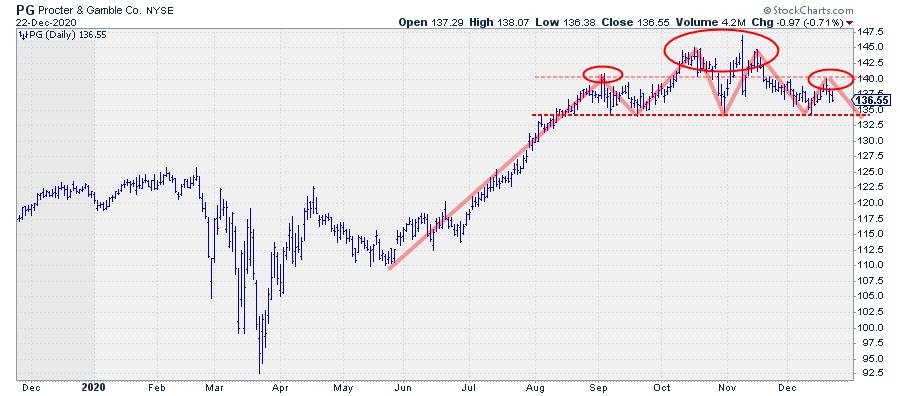 On the price graph, a reversal pattern seems to be developing that can be seen as a H&S reversal, in which the Head has taken the form of a double top, or M formation, if you will. What we need for this formation to execute is a break below the neck-line, which runs around $ 134.
On the weekly chart above, you can see that that neckline intersects with the rising support line that emerged out of the March low and is forming a double support level. When that gives way, it will very likely cause an acceleration lower in both price and relative terms.
A good reason to add PG to the short basket.
New Baskets
LONG (unchanged)
- CTSH
- FCX
- IVE
- SEE
- XLB
- XLC
SHORT
- ADBE
- FB
- INTC
- IVW
- ETR*
- PG*
#StaySafe, --Julius
Julius de Kempenaer
Senior Technical Analyst, StockCharts.com
Creator, Relative Rotation Graphs
Founder, RRG Research
Host of: Sector Spotlight
Please find my handles for social media channels under the Bio below.
Feedback, comments or questions are welcome at Juliusdk@stockcharts.com. I cannot promise to respond to each and every message, but I will certainly read them and, where reasonably possible, use the feedback and comments or answer questions.
To discuss RRG with me on S.C.A.N., tag me using the handle Julius_RRG.
RRG, Relative Rotation Graphs, JdK RS-Ratio, and JdK RS-Momentum are registered trademarks of RRG Research.


