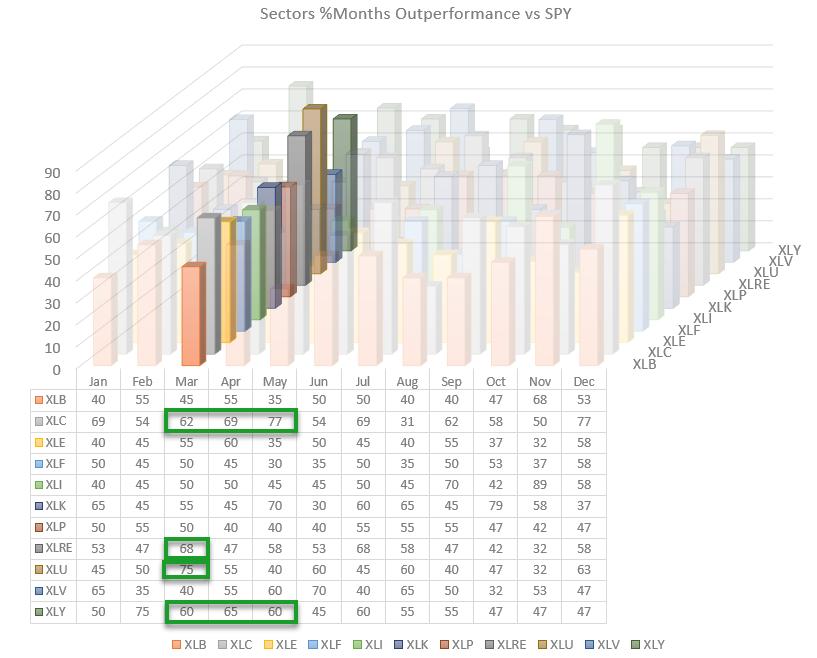
Looking at the 3-D seasonality chart above, most of the sectors have a 50/50 history of outperforming SPY in the coming month of March.
Both Communication Services and Consumer Discretionary are showing an upcoming string of months that are historically strong for them. XLC starts with 62% in March, but then moves to 69% and 77% in April and May. This suggests that a period of outperformance is starting for this sector. Or maybe it has already started. MTD in February, XLC is showing a 7.5% gain (vs. 3.9% for SPY).
Consumer Discretionary did not live up to the expectations for February, yet. So far, XLY gained 0.5% while SPY is up 3.9%; an underperformance of 3.5% MTD. Measuring seasonality is not an exact science, and the market does not always follow the expected path. The fact is that, historically, the period from February to May in general is a good period for Consumer Discretionary.
Real-Estate and Utilities are showing "blips" in their historical performance for March. What I mean is that both sectors are showing a promising percentage of historical outperformance for March - 68% and 75%, respectively. But the months before and after are mediocre at best. This is not a very reliable setup, imho. But it could provide us with a surprise.
Communication Services On Track
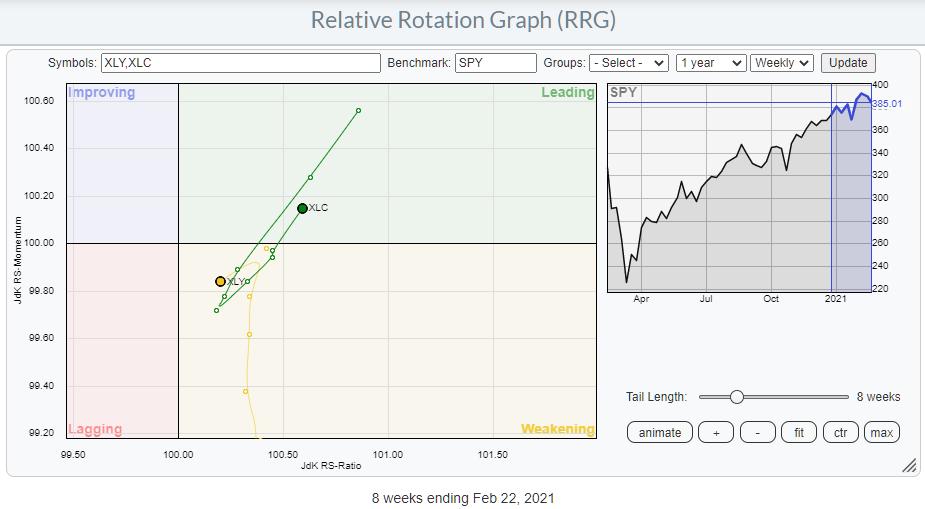
In the RRG above, I have isolated XLY and XLC to get a better view.
Where XLY was nicely rotating back up towards the leading quadrant at the close of last week, the first two days of this week are causing a sharp turn left towards the lagging quadrant. Not really the follow through that would be expected, based on both the seasonal pattern and the rotation in the RRG. But the week is not over yet, so it is too early to make a call here - but it certainly has my attention!
XLC is looking, and doing, much better. From last week's close onward, the sector is now jumping back into the leading quadrant and moving in-line with the expected seasonal pattern of outperformance in the period from March-May. For that reason, I prefer to focus on the Communication Services Sector, going into March, from a seasonal perspective.
The RRG below shows the individual members for the sector, using XLC as the benchmark.
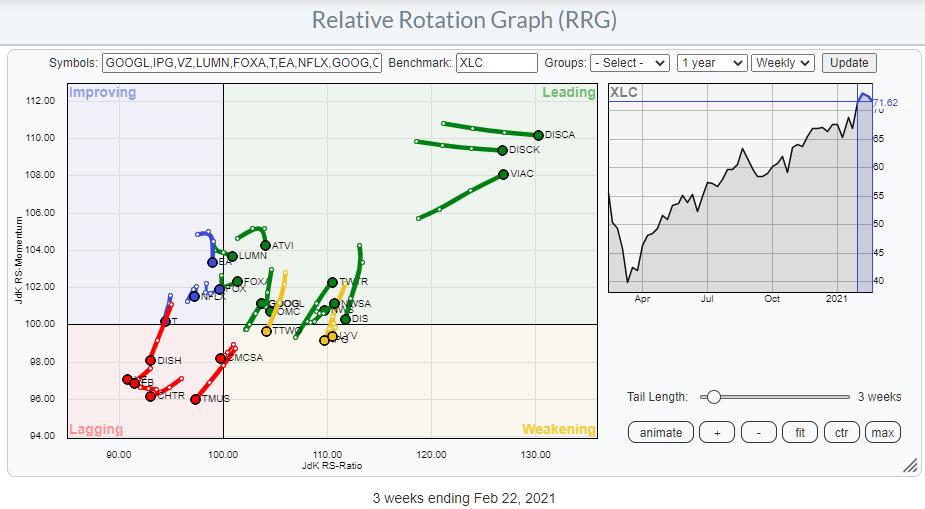
Going over the individual tails shows a number of stocks that continue to do very well, like VIAC and both DISCA and DISCK, but also TWTR and GOOG(L).
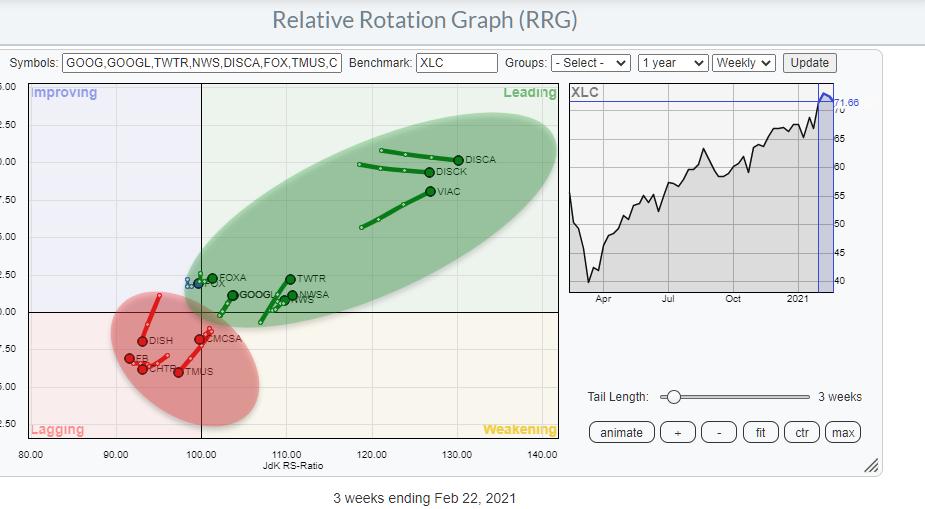
On the opposite side, there are a few names that are better avoided in this sector. These are FB, CHTR, DISH, TMUS and CMCSA. These stocks are highlighted in the RRG below.
Facebook - FB
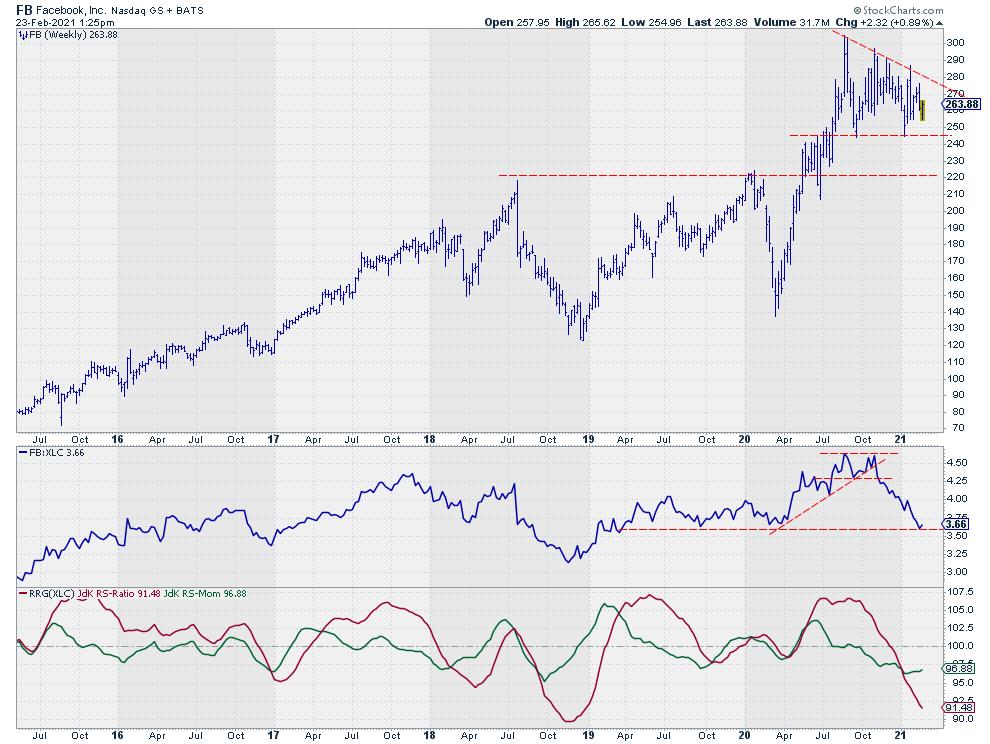
One of the major names inside XLC is FB. I have had FB as a short in the RRG Long/Short basket since mid-November last year. The relative strength line is hitting a horizontal support level at the moment, and the acceleration of the decline (JdK RS-Momentum) is flattening a bit. However, a break below support in relative strength will very likely bring back the acceleration lower.
On the price graph, a series of lower highs is becoming visible, which indicates that sellers are coming back at lower levels and buyers are only willing to buy at lower levels. The horizontal support area around $245 will be an important test case. When that level gives way to the downside, an acceleration lower is then also likely in price. Caution, therefore.
Alphabet Inc. - Google - GOOG
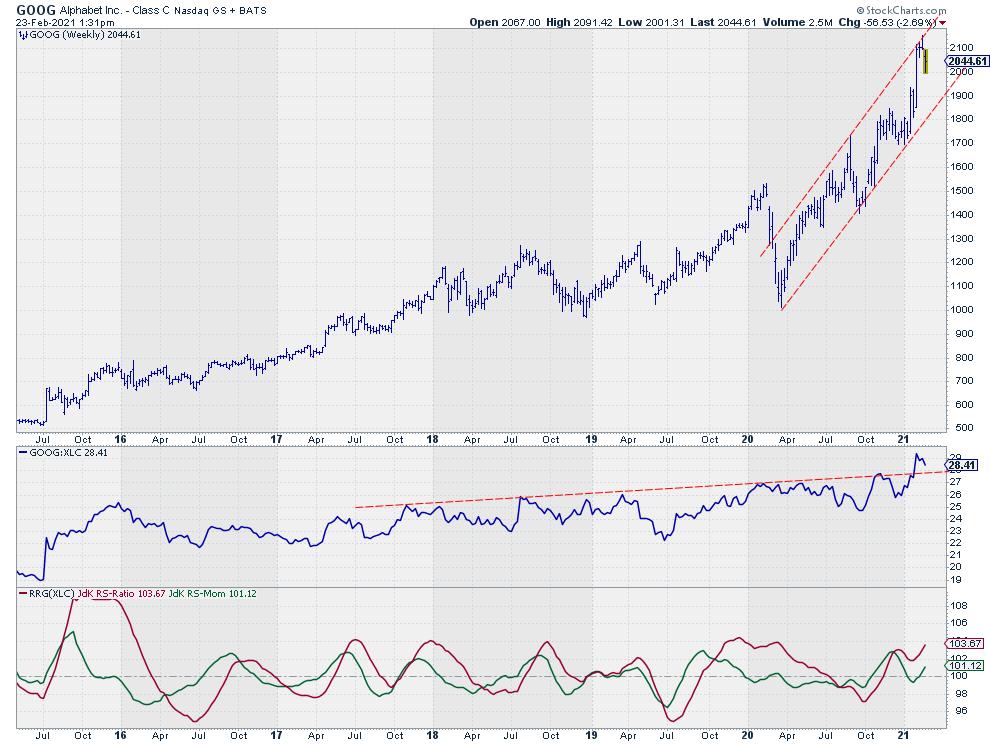
The strength in the price chart is clearly visible. The series of higher highs and higher lows is continuing within the boundaries of the rising channel that has started to take shape since early 2020.
But, more importantly, the relative strength line just broke away from a slowly ascending resistance and now has room to accelerate. This move is picked up by the RRG-Lines, which are now both back above 100 and rising after a swift leading-weakening-leading rotation.
XLC Outperformance Expected
All in all, the Communication Services sector seems aligned on both the Relative Rotation Graph and the expected seasonal pattern for further outperformance in coming weeks/months. Within the sector, there are some pretty clear distinctions that allow investors/traders to benefit from both the general direction for the sector and some of the discrepancies within.
#StaySafe, --Julius
Julius de Kempenaer
Senior Technical Analyst, StockCharts.com
Creator, Relative Rotation Graphs
Founder, RRG Research
Host of: Sector Spotlight
Please find my handles for social media channels under the Bio below.
Feedback, comments or questions are welcome at Juliusdk@stockcharts.com. I cannot promise to respond to each and every message, but I will certainly read them and, where reasonably possible, use the feedback and comments or answer questions.
To discuss RRG with me on S.C.A.N., tag me using the handle Julius_RRG.
RRG, Relative Rotation Graphs, JdK RS-Ratio, and JdK RS-Momentum are registered trademarks of RRG Research.


