Good money management can help you a great deal in managing portfolios. Rebalancing is a very important part of that discipline. In this article, I am reviewing the current RRG Long/Short basket, replacing XLB and FTI with EBAY and MSFT while at the same time bringing all positions back to their original $10k market value.
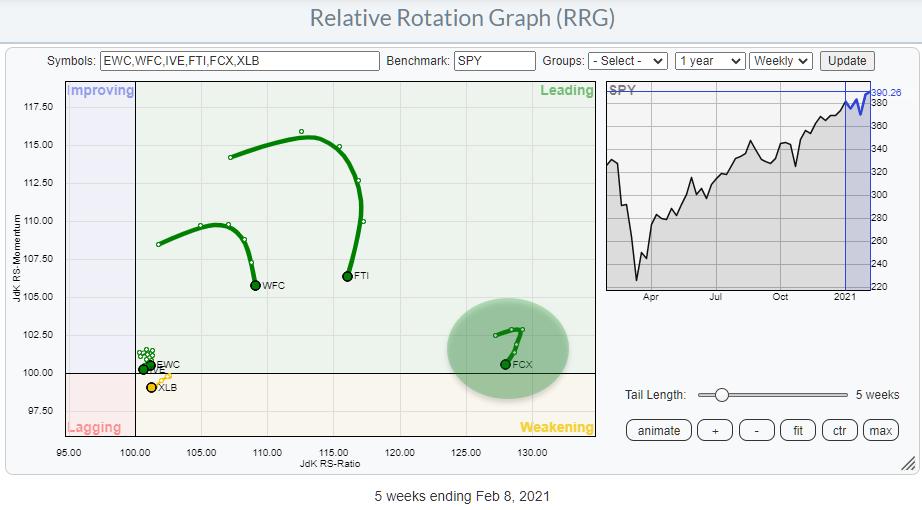
The above Relative Rotation Graph shows the rotation for the six holdings in the Long/Short RRG basket.
I haven't paid enough in-depth attention, shame on me, the last few weeks. I was basically monitoring the performance every now and then and concluded that all was going pretty OK. Until the second week of January. All of a sudden, the P/L of the basket plummeted.. Wow, where did that come from?
The first thing to look at was the RRG for the Long positions, as printed above. Despite the fact that all members are heading South or South-West, they are all still at the right side of the graph. In particular, the charts for the positions furthest to the right are still looking pretty good. The cluster closer to the center of the chart needs more inspection.
But, other than that, the performance on the long side came off slightly after a run up that should not create such a dent in P/L.
The second chart to check is the RRG for positions on the Short side.
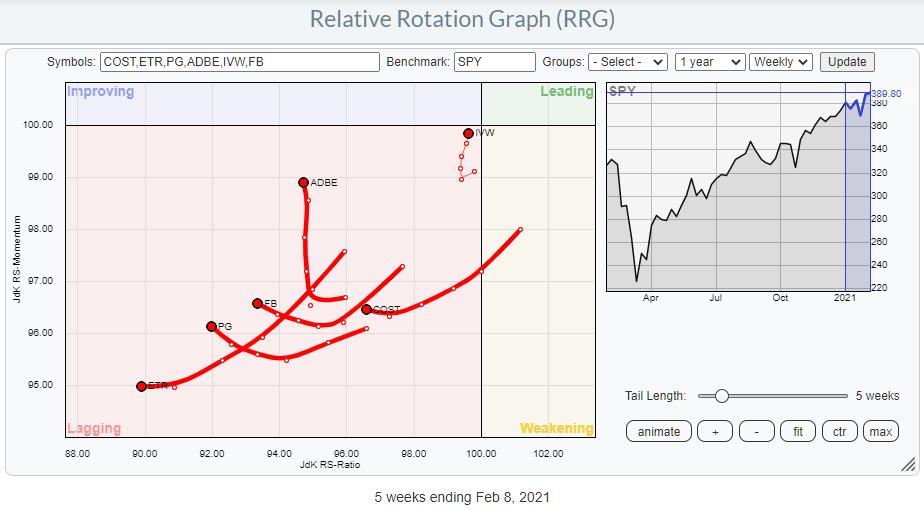
Most of these tails are nicely on track for further underperformance. ADBE and IVW need a bit more attention as they started to move higher on the RS-Momentum scale, but, other than that, no big dramas at first sight. As a reminder, a "drama" on an RRG holding short positions would be a big fat green tail powering into the leading quadrant.
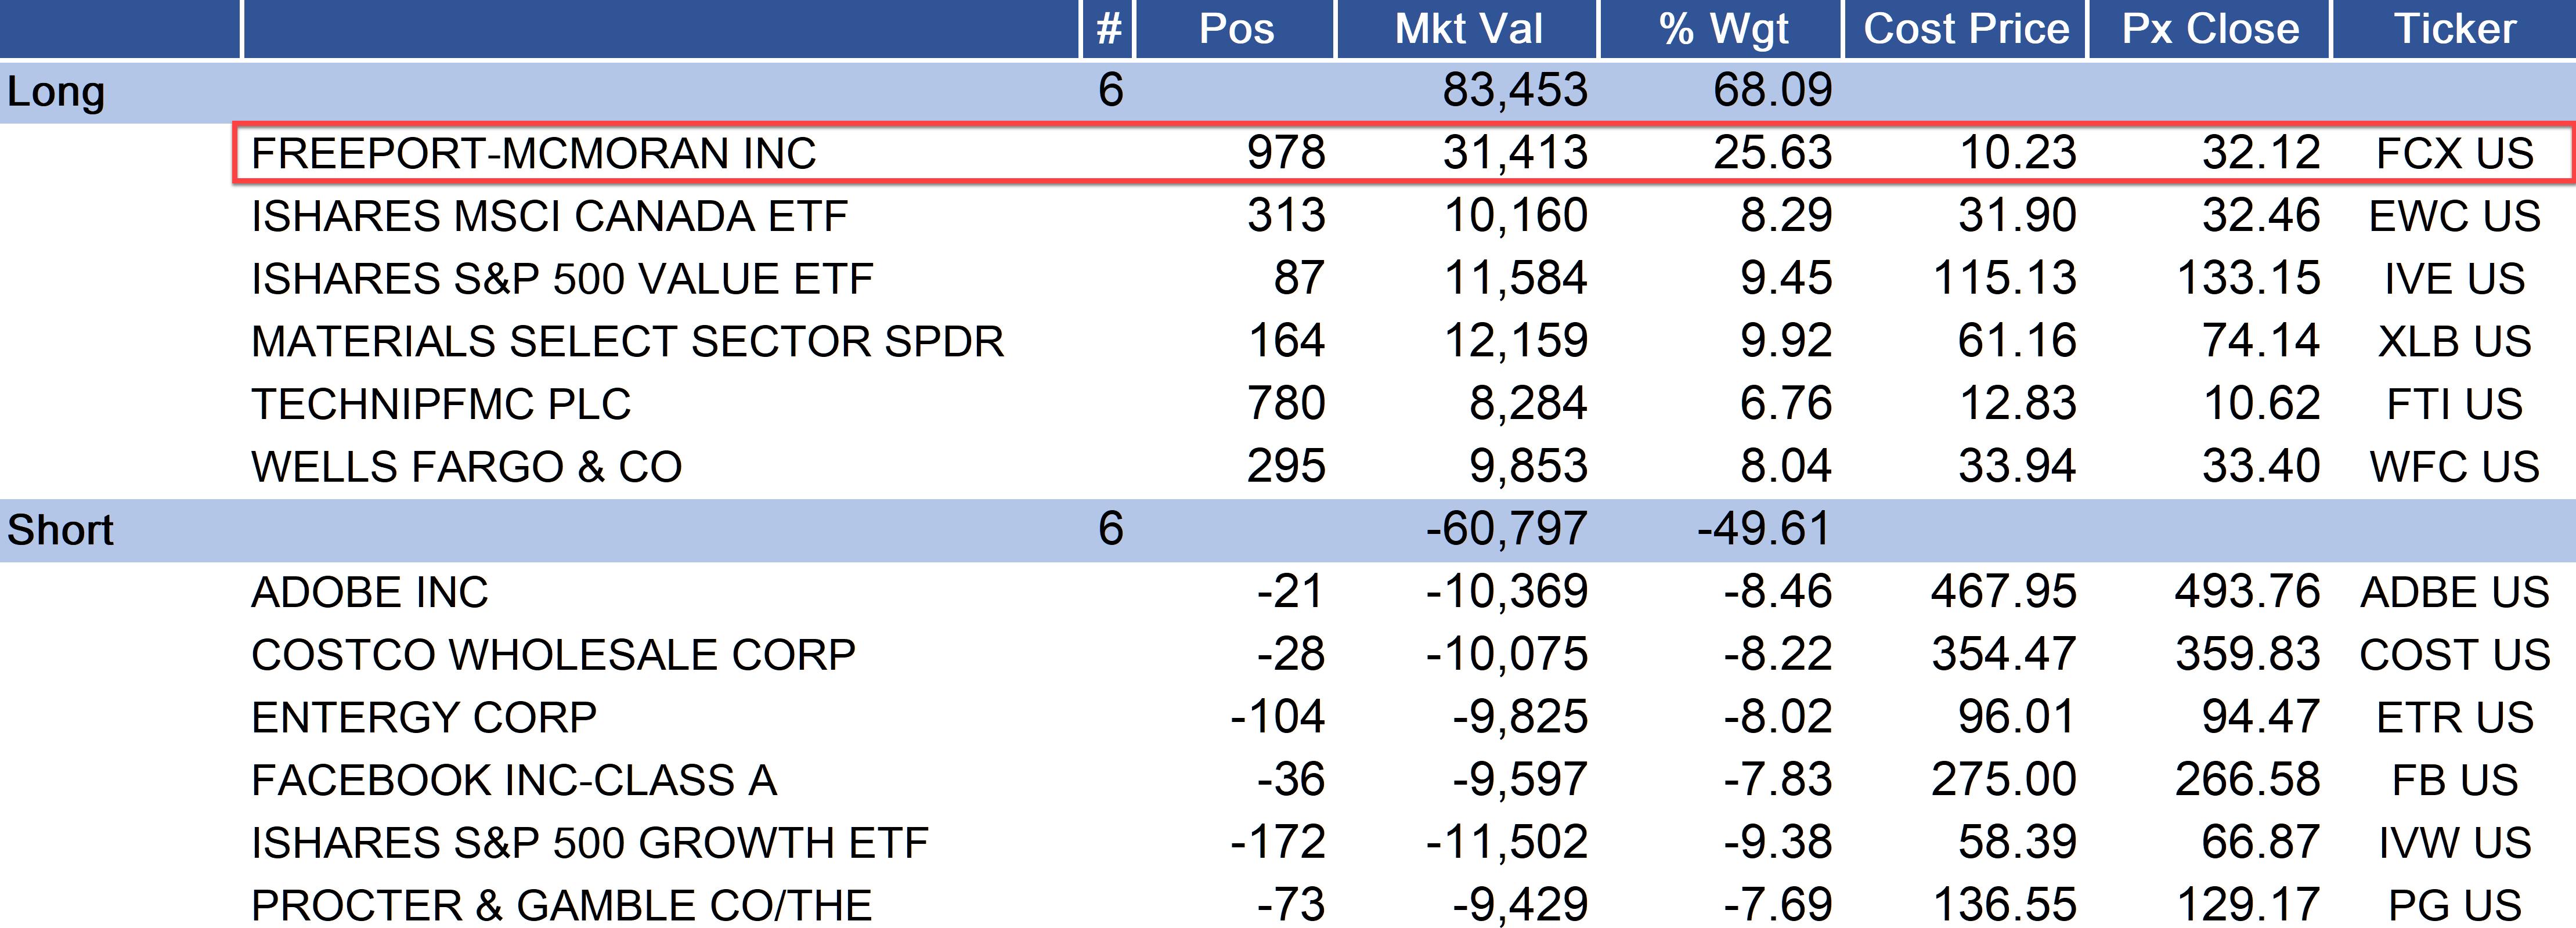
The next thing was to look at the table of the holdings on both sides, and here you can immediately see the "problem."
Remember, this RRG Long/Short basket is an educational exercise to build views and generate trading ideas around Relative Rotation Graphs and keeping track of them to create some sort of accountability. It is in no way, shape or form a "model-portfolio," let alone "investment advice" - just a way to keep an eye on set-ups and ideas I discussed here in the RRG blog or in Sector Spotlight.
The MO is to enter a position with $10k on either side and keep the number of positions in balance. The idea is to have and maintain a balanced portfolio with an equal number of longs and shorts, which theoretically means a market neutral position.
What we need in case of a rise in the general market is for the longs to rise faster than the shorts and, if the market goes down, the shorts need to fall faster than the longs.
When you check the table above, you will pretty much immediately see that FCX is now > 25% of the portfolio on the long side, with an exposure of more than $30k, where we started the position at $10k. Of course, the rally in price is nice, but it is also distorting the idea behind the portfolio.
First of all, the basket is now NET long, around 15%, while the attempt is to maintain a market neutral portfolio.
So, when the biggest holding then takes a dive of almost 20%, THAT hurts!! What can we do?
The Answer is Rebalancing.
Rebalancing means bringing the weights for the positions in a portfolio back down, or up, to the desired and intended levels. For the RRG Long/Short basket, that means bringing all positions back to $10k, or 10%, assuming a 100k portfolio.
From the table, you can easily calculate how many shares you need to buy or sell per position to get to the desired amount. Before I do that, I will first review the positions that need some extra attention to see whether I want to keep them or close them.
Long
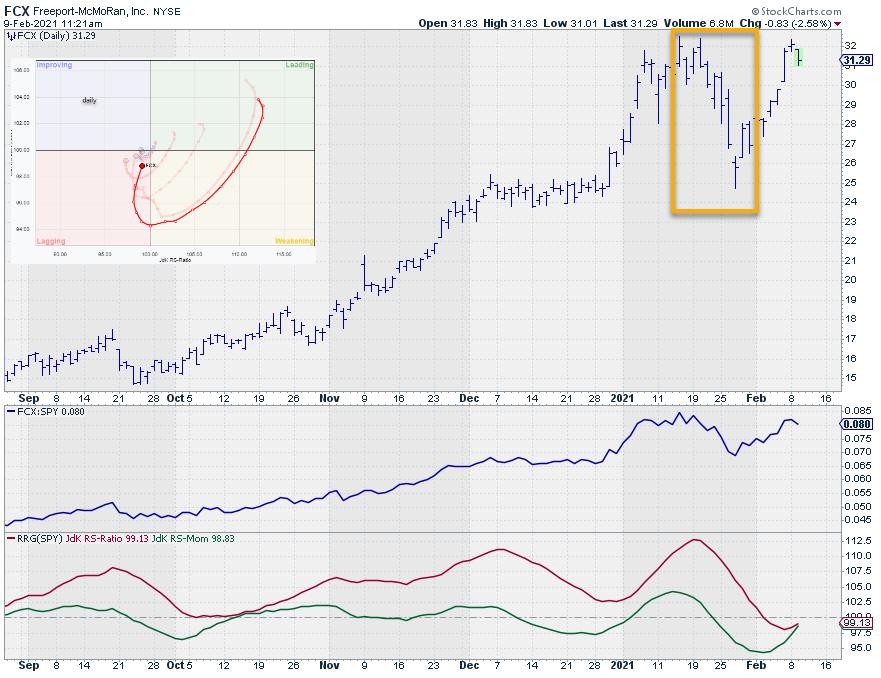
FCX: Seems to be having trouble taking out the previous high, and being a Materials stock does not help either. For now, scaling back to 10%. Keep an eye for possibly closing the position if things don't improve soon.
FTI: Failed to move beyond gap resistance and is now falling back into the previous range, while relative strength is rolling over. Closing position as the stocks most likely needs more time to recover.
WFC: Slowly but surely continues to improve and now pushing against resistance. Relative Strength is holding up just above its previous resistance level.
EWC: On the RRG, EWC is still struggling to get out of the lagging quadrant and into improving at a very short tail. The recent jump above it previous high in price will most likely start to help the improvement of relative strength.
IVE: The price chart is doing okay, just about to cross to new high, but relative strength is a bit disappointing. Value stocks could not keep the momentum that was initially there. With the tail on the daily RRG rotating back to improving, I am going to watch IVE and the rotation against IVW in the short basket closely and be prepared to say goodbye. Benefit of the doubt for now.
XLB: Materials seem to have lost their mojo.. especially in terms of relative strength vs. SPY and other sectors. The tail is rolling over and heading towards the lagging quadrant. For the time being, price is holding up above the rising support line, but that's about it. There are better sectors out there than Materials at the moment. Taking this position off the list.
NEW position - MSFT
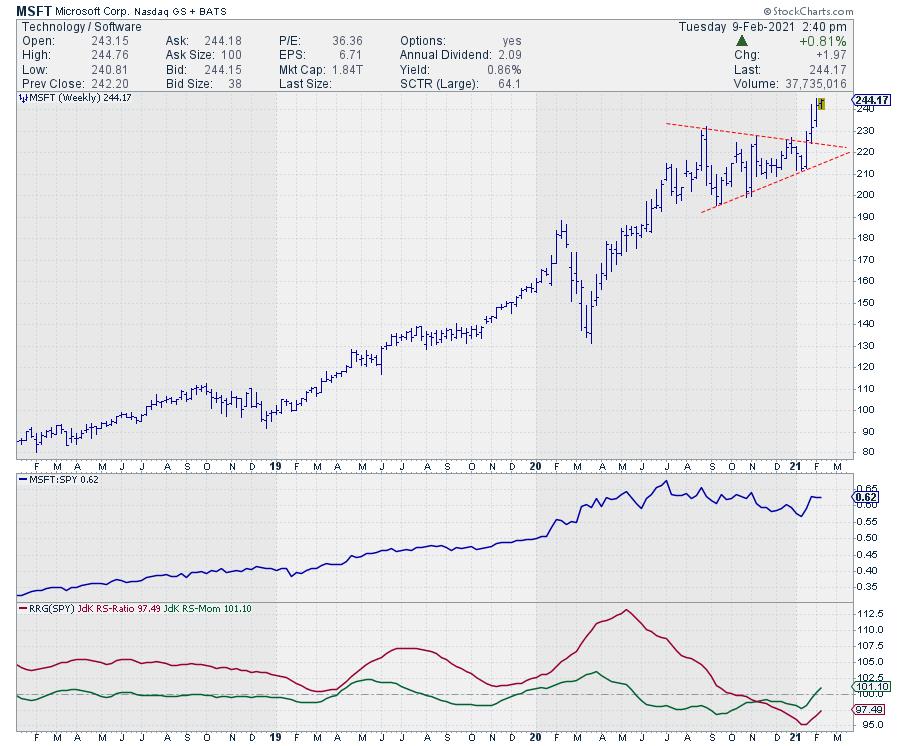
With Technology rotating back to the leading quadrant and MSFT positioned inside the improving quadrant against XLK (and also against SPY), it is an interesting candidate for addition on the long side. But based on the rotation of the tail, so is AAPL. However, on the price chart, MSFT has managed to break away from its consolidation triangle and is now moving higher, while AAPL seems to be having trouble with overhead resistance around $140. Hence my preference for MSFT at this time.
New Position - EBAY
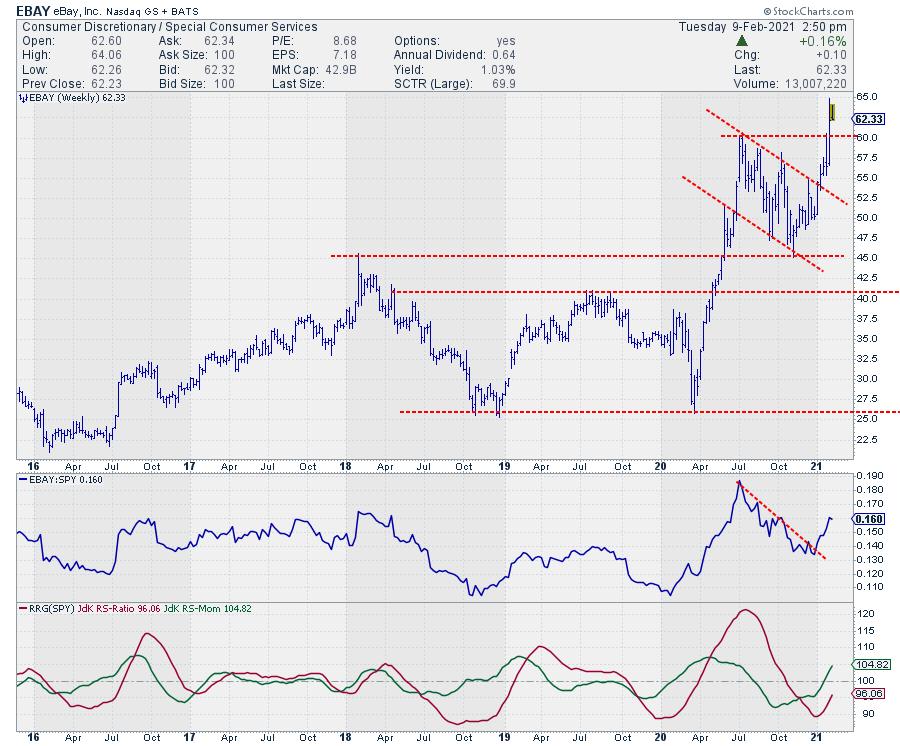
EBAY is still positioned inside the improving quadrant, but is rapidly heading towards leading at a strong RRG-Heading. With price breaking to new highs above its previous peak, EBAY makes it to the list as a new long position.
Short
ETR: Doing what we want it to do! Drop in price and underperforming SPY. As a result, it is heading deeper into the lagging quadrant.
PG: Also right on track. Completed its H&S top formation while breaking horizontal support in relative strength, pushing PG further into lagging. The slight pickup in relative momentum is no problem for now.
FB: Same as PG. Continuing to do what it should do. Slight pickup in relative momentum no problem yet.
ADBE: Still in consolidation. Looks like a symmetrical triangle. It's the lower highs and lower lows in the relative strength line that support a continued underweight/short position for ADBE
COST: Broke rising support in both price and relative strength, which pushed the tail deeper into lagging.
IVW: The opposite of IVE. Maintaining the short with benefit of the doubt.
ReCap
All in all, this combination of removing XLB and FTI from the long side and replacing them with MSFT and EBAY and rebalancing all positions to $10k results in this basket of Long and Short positions.
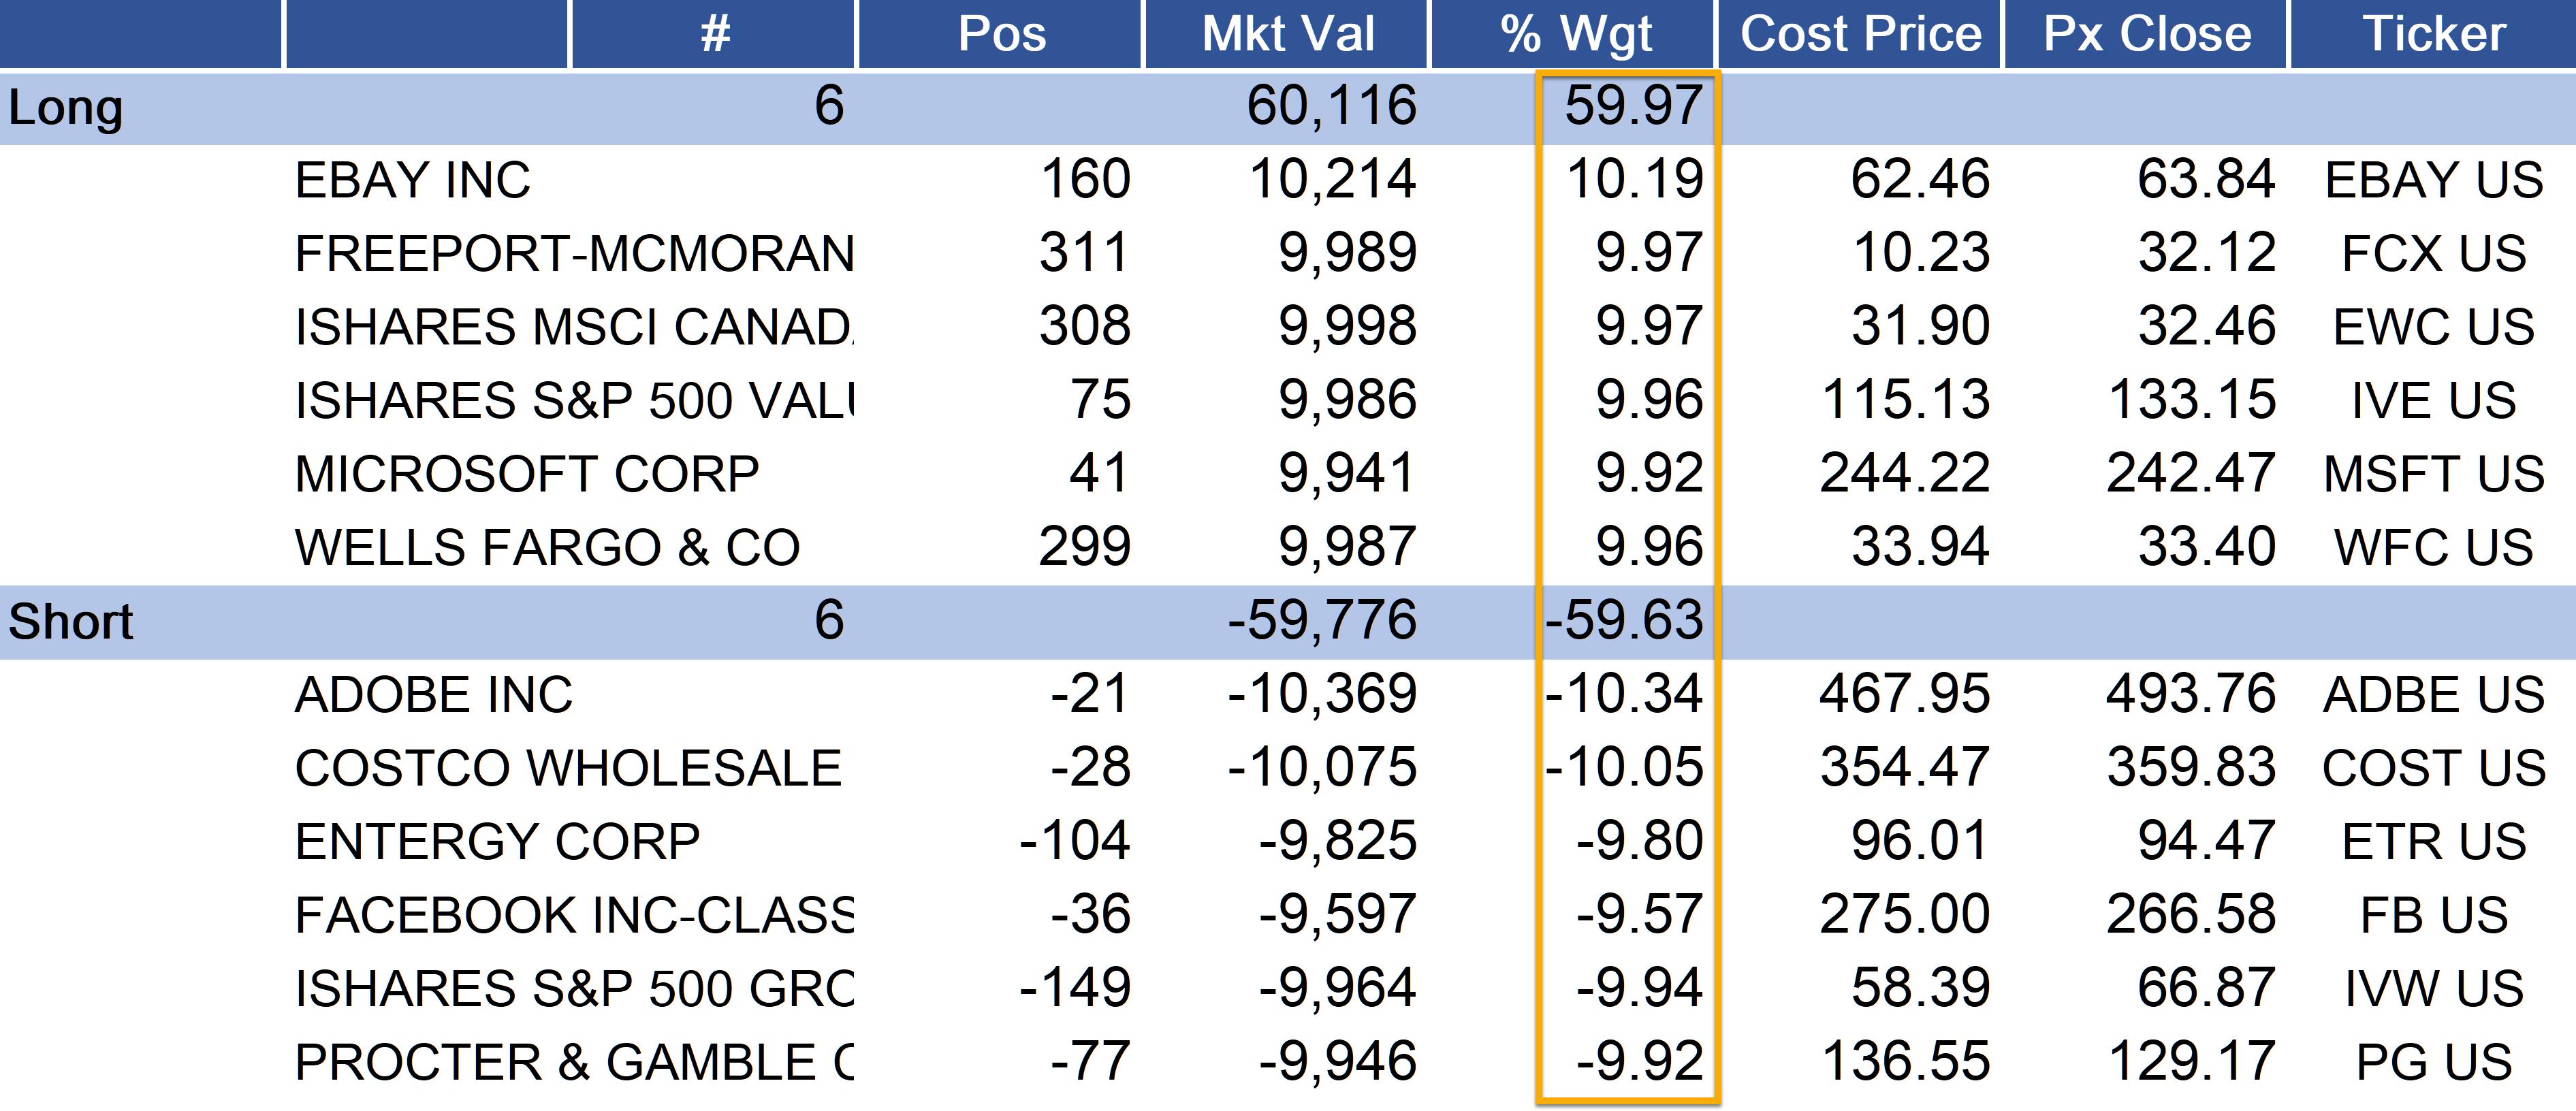
As you can see, all positions are now (as close as possible to) $10k and we are using 60% of capacity in a 100k portfolio. 6 positions on either side.
Note to self: Do a better job monitoring this basket. Use the daily mail recap function at StockCharts.com and alerts to stay on top!!!
#StaySafe, --Julius
Julius de Kempenaer
Senior Technical Analyst, StockCharts.com
Creator, Relative Rotation Graphs
Founder, RRG Research
Host of: Sector Spotlight
Please find my handles for social media channels under the Bio below.
Feedback, comments or questions are welcome at Juliusdk@stockcharts.com. I cannot promise to respond to each and every message, but I will certainly read them and, where reasonably possible, use the feedback and comments or answer questions.
To discuss RRG with me on S.C.A.N., tag me using the handle Julius_RRG.
RRG, Relative Rotation Graphs, JdK RS-Ratio, and JdK RS-Momentum are registered trademarks of RRG Research.


