 In today's episode of Sector Spotlight, I cover, or at least try to, the complete investment landscape from asset allocation, all the way down to stocks at sector level.
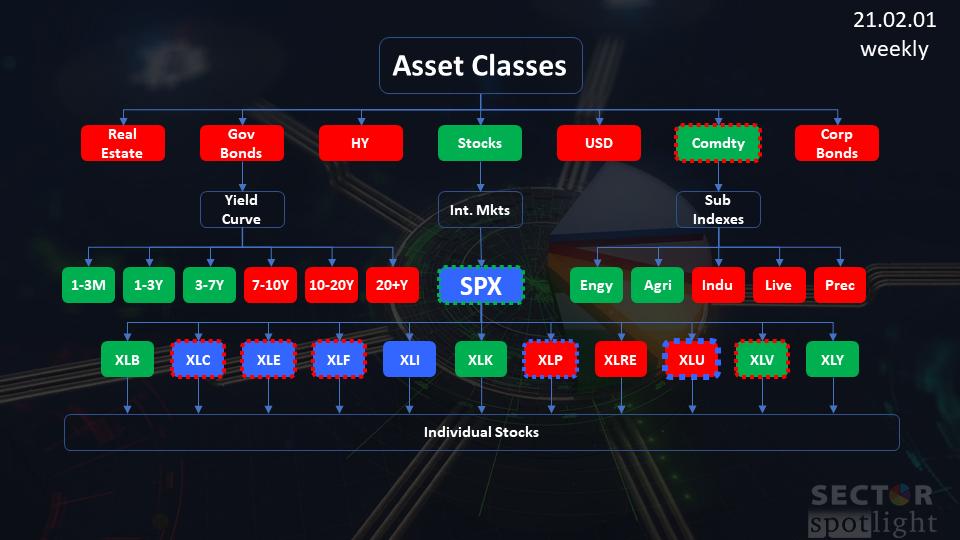
With the monthly bars for January just completed, I stuck to my guns, looking at the long-term trends on these monthly bar charts for asset classes and stock-sectors. In the investment pyramid, I then color-code the blocks for each asset class with my view, which can either be Bullish (=overweight), Neutral or Bearish (=Underweight).
The "views" are based on a combination of the long term trends as we analyze them on the monthly charts, the weekly Relative Rotation Graphs for that particular section of the pyramid and, of course, the ultimate health check on the weekly bar-chart, in combination with relative strength and RRG-Lines.
Asset Allocation
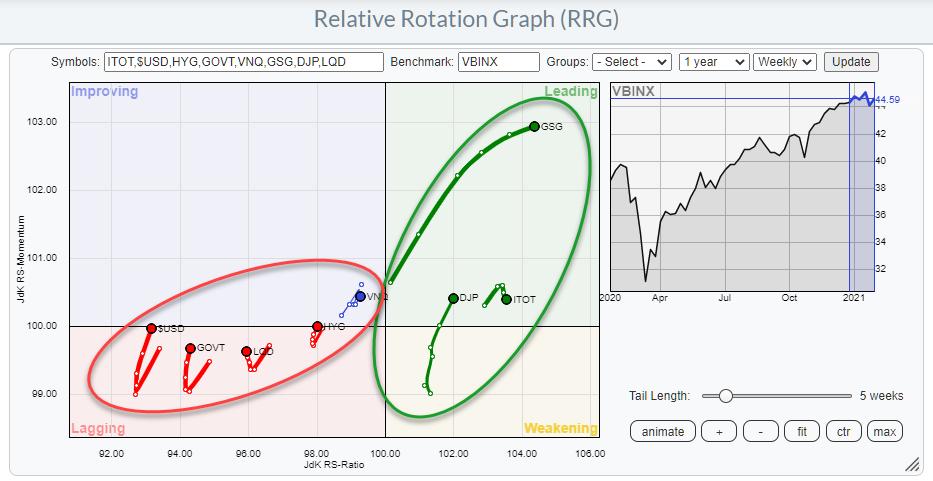
The RRG for Asset Classes shows both Commodity indexes and ITOT (stocks) inside the leading quadrant. Commodities are still traveling at a strong heading, while stocks just rolled over. I have labelled both stocks and commodities as bullish/overweight on the pyramid.
The rotation of ITOT is with a very short tail, which suggests that there is not a lot of momentum behind this rotation yet. And that makes it very well possible for ITOT to complete a rotation at the right hand side of the RRG, Leading-Weakening-Leading. All other asset classes are on underweight for the time being, despite the fact that they have curled upward over the past three weeks. The odds are not in their favor yet.
On the next layer of the pyramid, I am looking at (Government) Bonds with various maturities, essentially trying to gauge for best positioning on the yield curve. I try to put US stocks in an international perspective and also break down commodities into various sub-indexes for a more granular view.
International Stock Markets
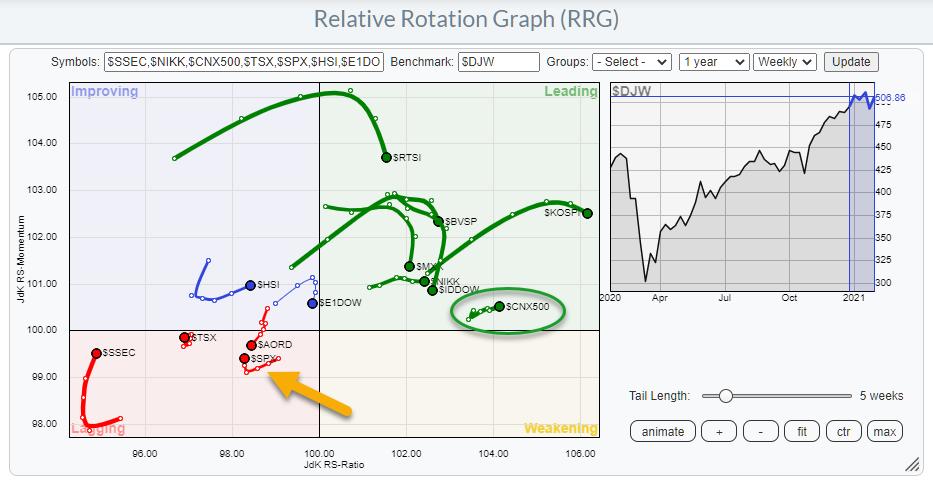
When we put the US in an international perspective using the RRG above, we can see the rotations for the various market indexes vis-a-vis around the DJ Global index.
The S&P 500 (US) is found inside the lagging quadrant, where the tail has just started to curl back up a little bit, but at a very short tail, indicating low momentum/power. Markets like India ($CNX500), Brazil ($BVSP) and Japan ($NIKK), on the other hand, are much better positioned inside the leading quadrant for the time being.
So despite an overweight/bullish view for US stocks, it makes sense to also have a look at some foreign markets.
NIFTY
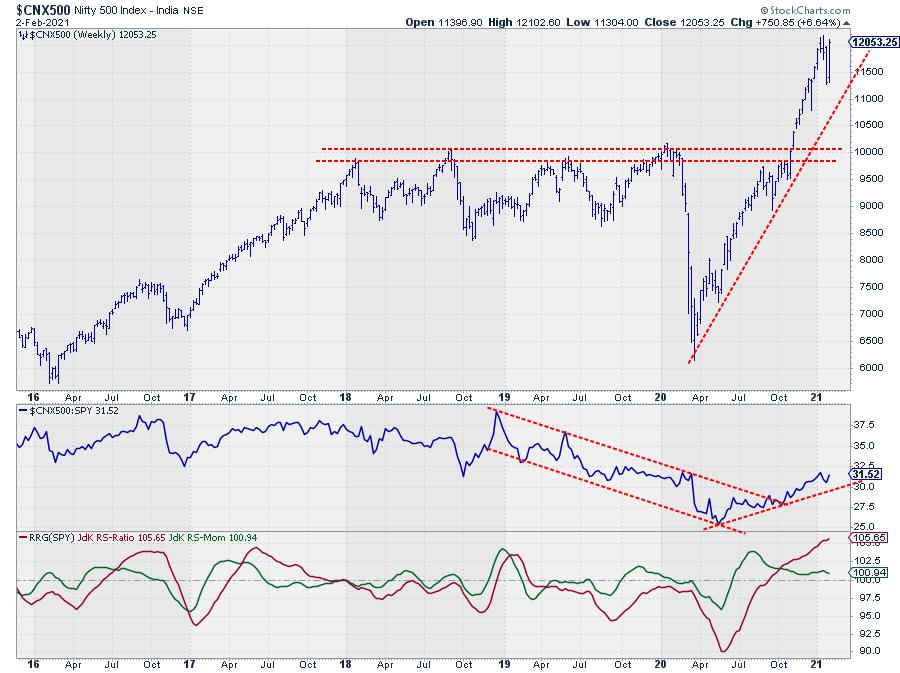
The Indian NIFTY 500 index broke above its important overhead resistance back in November and embarked on a strong rally. After a little dip at the start of the year, this market is now back up and pushing to break above its most recent all-time-high.
Government Bonds
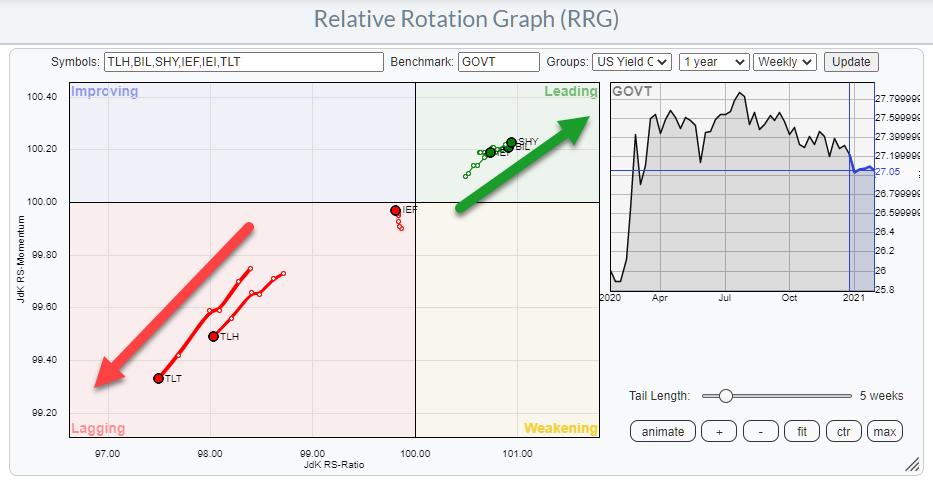
The picture painted by the RRG, which shows the rotation of bonds with various maturities around the aggregate GOVT ETF (includes all maturities), could not be clearer.
- The preference should clearly be for short-dated bonds - SHY, BIL and IEI - and to avoid longer-dated bonds, TLH and TLT. IEF is close to the benchmark, which is to be expected as it is roughly in the middle of the curve.
- The rotation clearly shows the current steepening of the curve and how it is accelerating at the moment.
When building a portfolio, this means that if you still have a bond allocation in it, and there can be many good reasons why you would do that (overall risk tolerance, for one), it would be wiser to allocate to the shorter durations.
Commodities
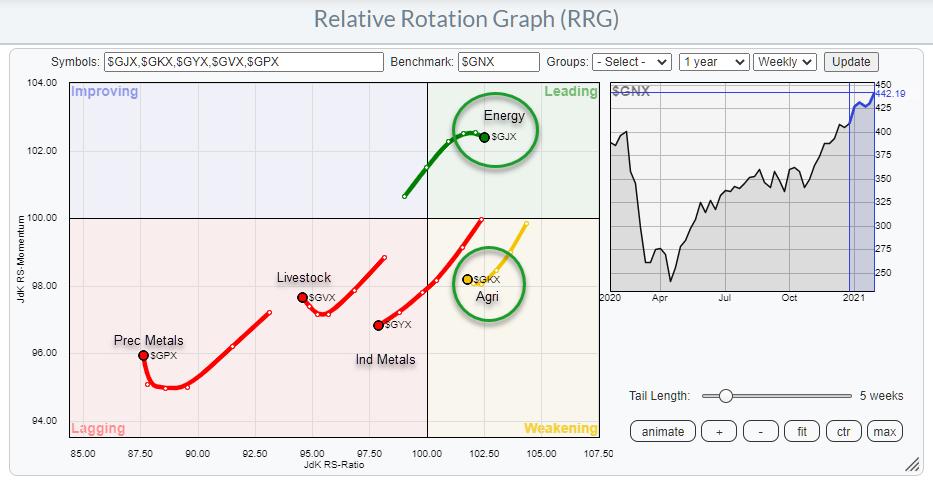
When we break down the asset class commodities into sub-indexes, we find the Energy and Agriculture groups at the right hand side of the graph as drivers, especially Energy, of the recent rally.
Despite the tail on Energy rolling over a bit, it still remains the strongest group in this universe. It may be time for a bit of a break for this group. Agri, inside weakening and carefully starting to curl up, could be a good replacement. The other three groups inside the lagging quadrant remain weak for now, despite their small up-moves over the last three weeks.
Energy - $GJX
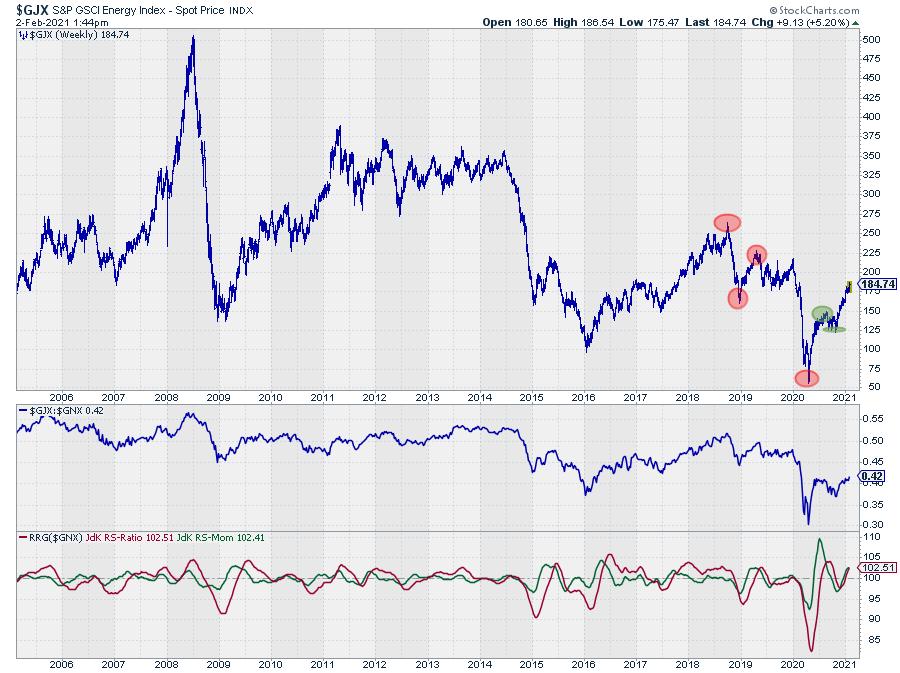
Looking at this long-term chart of the Energy group shows the massive decline through which this group went. Given the heavy weight of Energy inside the S&P GSCI commodity index ($GNX), that chart looks largely the same.
From levels near $500 in 2008, Energy came down to $50 in the first half of 2020, with some very big swings in between. It is hard to draw a proper trendline, but, by observing the locations of major highs and lows since 2018, it looks as if Energy is turning around. It has started a new series of higher highs and higher lows and is emerging into a new uptrend.
Despite the big run we already had, there may be more in store for this group and commodities as a whole. The relative strength against $GNX looks to be embarking on an uptrend of its own soon. All in all, this makes Commodities, Energy in particular, an interesting addition to a balanced portfolio next to stocks.
#StaySafe, --Julius
Julius de Kempenaer
Senior Technical Analyst, StockCharts.com
Creator, Relative Rotation Graphs
Founder, RRG Research
Host of: Sector Spotlight
Please find my handles for social media channels under the Bio below.
Feedback, comments or questions are welcome at Juliusdk@stockcharts.com. I cannot promise to respond to each and every message, but I will certainly read them and, where reasonably possible, use the feedback and comments or answer questions.
To discuss RRG with me on S.C.A.N., tag me using the handle Julius_RRG.
RRG, Relative Rotation Graphs, JdK RS-Ratio, and JdK RS-Momentum are registered trademarks of RRG Research.


