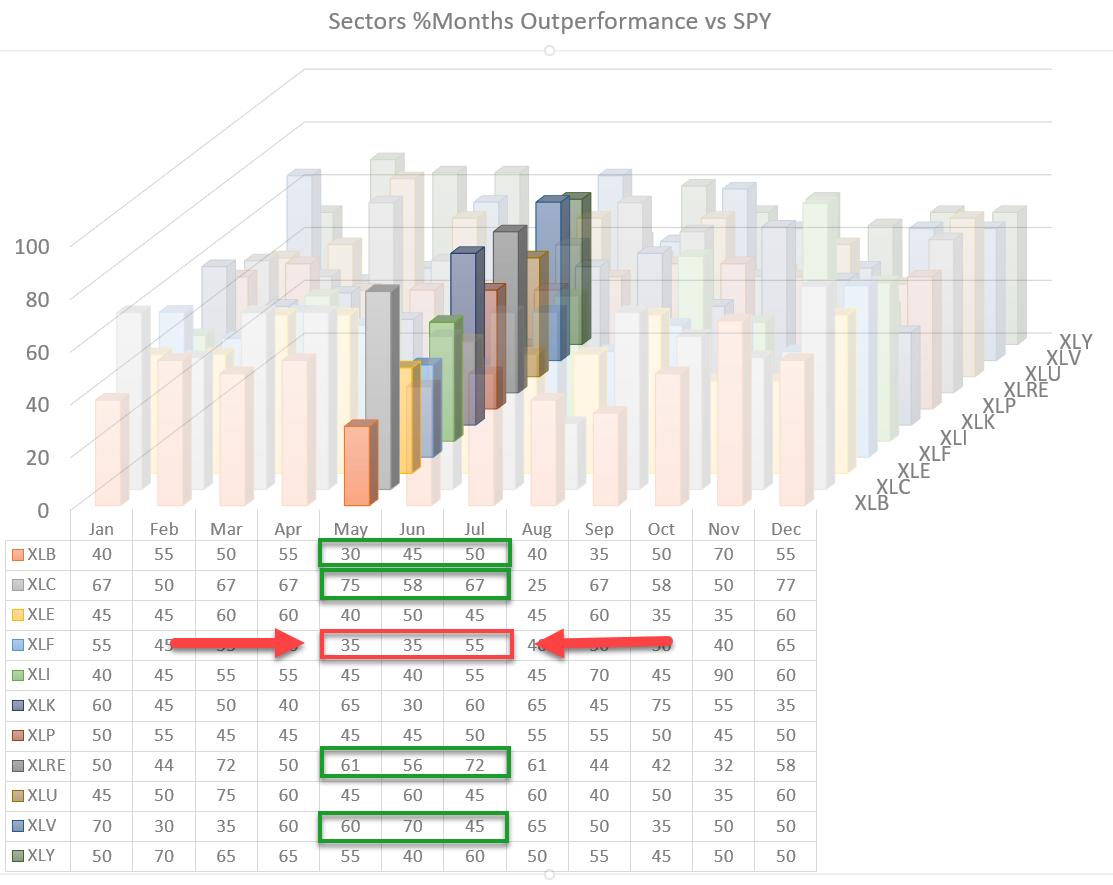
Looking at the 3D visualization for US sectors going into May, one sector stands out negatively. That sector is Financials, the fourth largest sector at ~11% of market cap.
For May and June, the historical record is that the Financial sector outperforms the S&P 500 only 35% of the time. This means that, 65% of the time, this sector has UNDERperformed SPY.
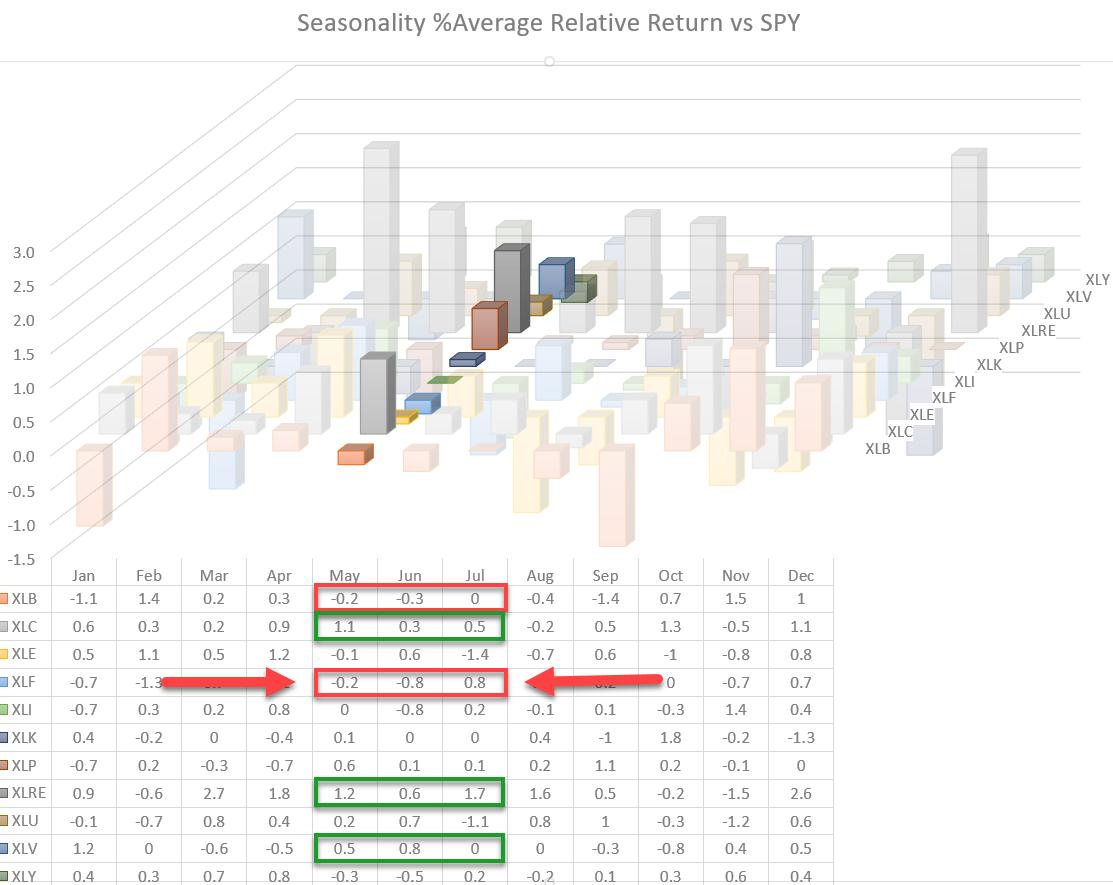
The second graph and table above show the average over-/under-performance per sector vs. SPY. As you can see, the Financials sector (XLF), on average, underperformed SPY by 20 Bps in May and even by 80 Bps in June.
This aligns with the expectation of underperformance in May and June.
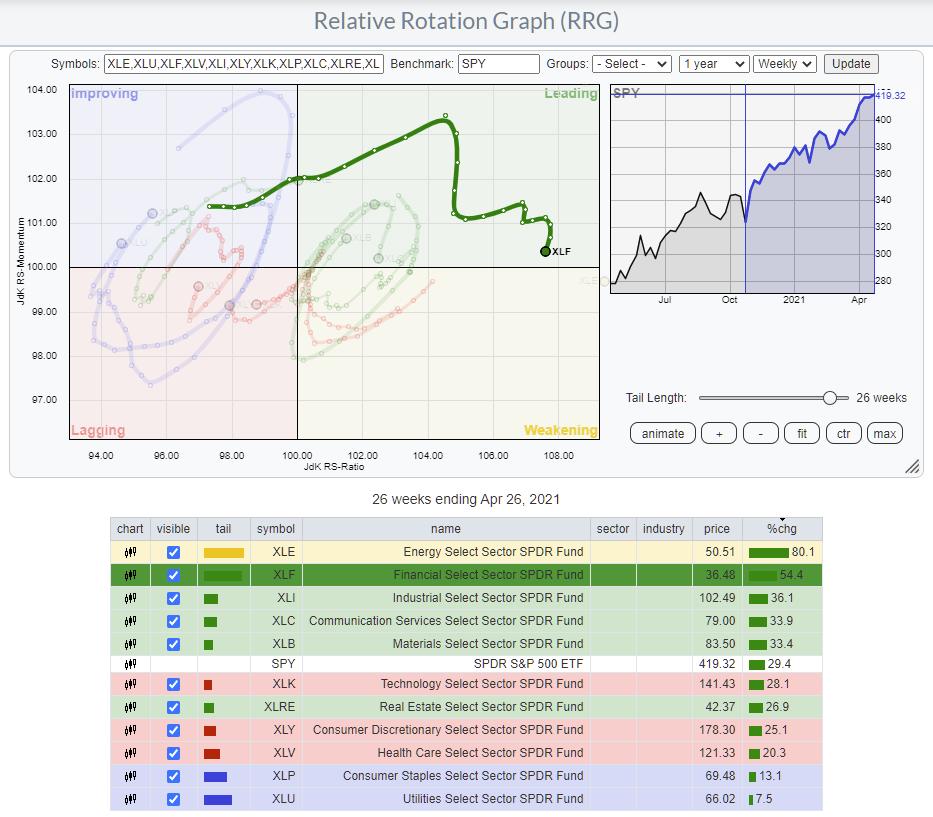
The Relative Rotation Graph above highlights the rotation for XLF over the last two quarters. In the table, you can see that XLF was the second strongest performer over that period, beating SPY by more than 20%, but a few weeks since, the tail on XLF has started to roll over and move downwards, heading towards the weakening quadrant. This loss of relative momentum aligns with the weak expectation for the sector going into May, with a follow-through into June.
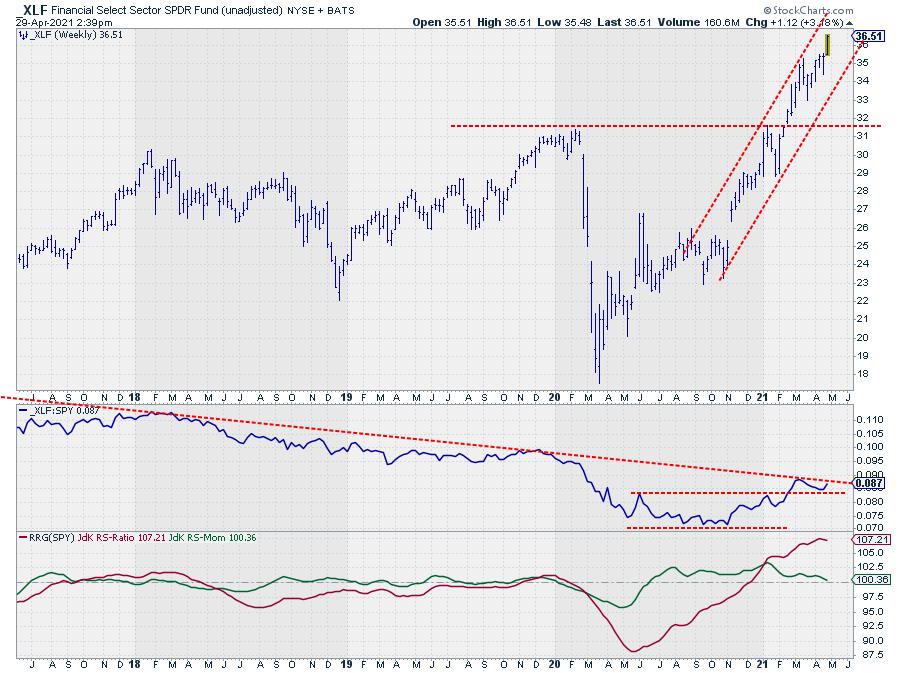
On the price chart, the uptrend for XLF is fully intact and continues to move higher within the boundaries of the rising channel. The "problem" is with the relative strength vs. SPY. The long downtrend is still intact, albeit that the RS-Line is currently testing the descending resistance line. The recent fading of momentum brings the green JdK RS-Momentum line close to crossing below 100, and it is starting to drag RS-ratio lower as well.
The combination of relative strength stalling against resistance and the expected seasonal weakness make Financials a sector to watch out for in the coming weeks/months. The upside potential is looking very pale.
--Julius
Julius de Kempenaer
Senior Technical Analyst, StockCharts.com
Creator, Relative Rotation Graphs
Founder, RRG Research
Host of: Sector Spotlight
Please find my handles for social media channels under the Bio below.
Feedback, comments or questions are welcome at Juliusdk@stockcharts.com. I cannot promise to respond to each and every message, but I will certainly read them and, where reasonably possible, use the feedback and comments or answer questions.
To discuss RRG with me on S.C.A.N., tag me using the handle Julius_RRG.
RRG, Relative Rotation Graphs, JdK RS-Ratio, and JdK RS-Momentum are registered trademarks of RRG Research.


