The Big Growth to Value Rotation, which has been going on for months, seems to be slowing down. NOT REVERSING, yet, but slowing down!
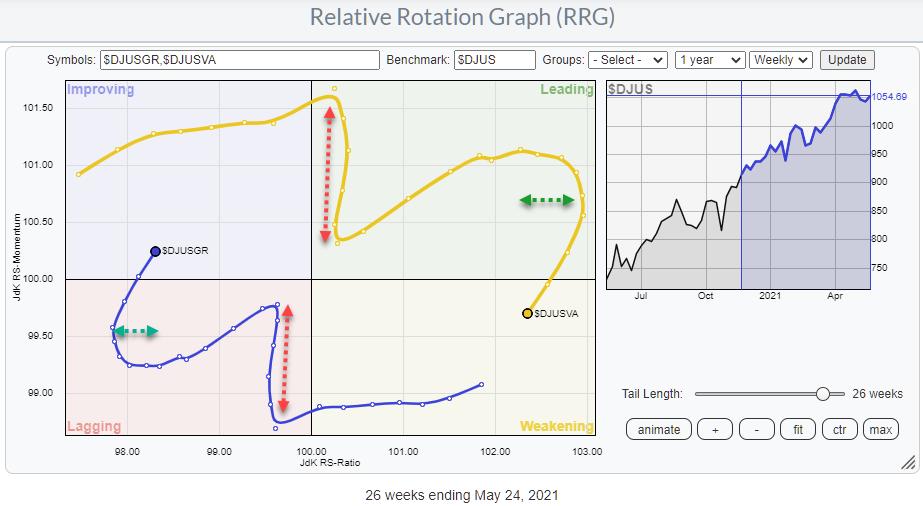
In the RRG Long/Short baskets, we have IVE on the Long side and IVW on the Short side since September 2020. Looking at the RRG above, we can see that the tails for Growth and Value moved almost vertically from mid-January until the end of February. This was a move in favor of Growth, but only momentum-based. During that period, there was little or no movement on the horizontal JdK RS-Ratio axis.
The current pick-up in rotation favoring Growth has started to pick up strength on the RS-Ratio scale as well. Growth has now entered the improving quadrant, while Value has moved into weakening. Clearly, Value remains to the right of Growth, which indicates that the trend is still in favor of Value over Growth.
However, cracks are starting to appear.
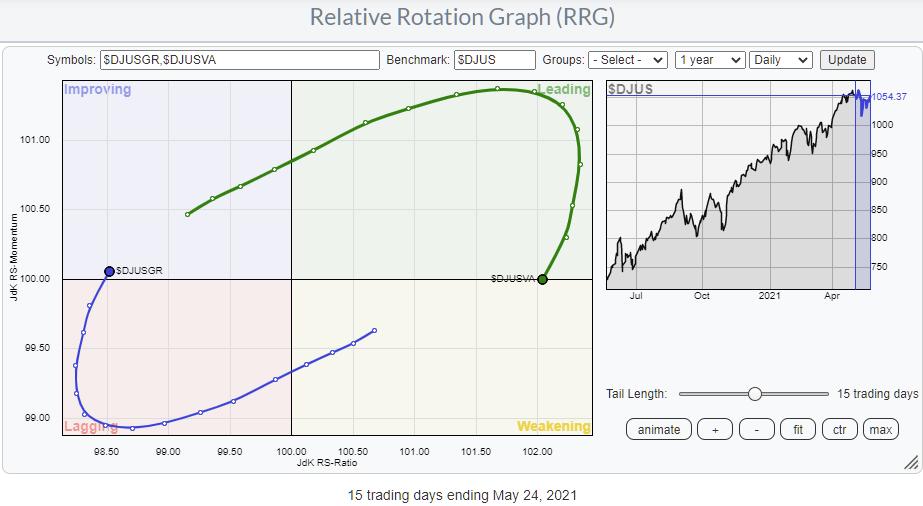
If we zoom in on the daily rotation, a more or less similar image appears. Value is moving from leading into weakening, while Growth is pushing into improving from lagging.
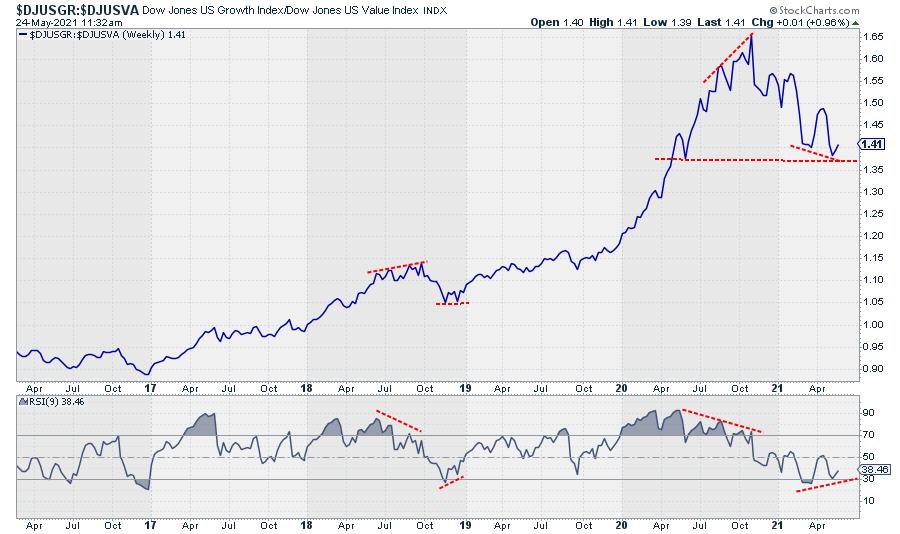
Looking at the weekly ratio chart, you can see that the last leg down pushed only marginally below its previous low. This in itself is already pointing to a slowdown in the decline. When I added the RSI (9 periods), I noticed an emerging positive divergence. And, looking back to previous divergences between this ratio and RSI, I noted they were pretty reliable.
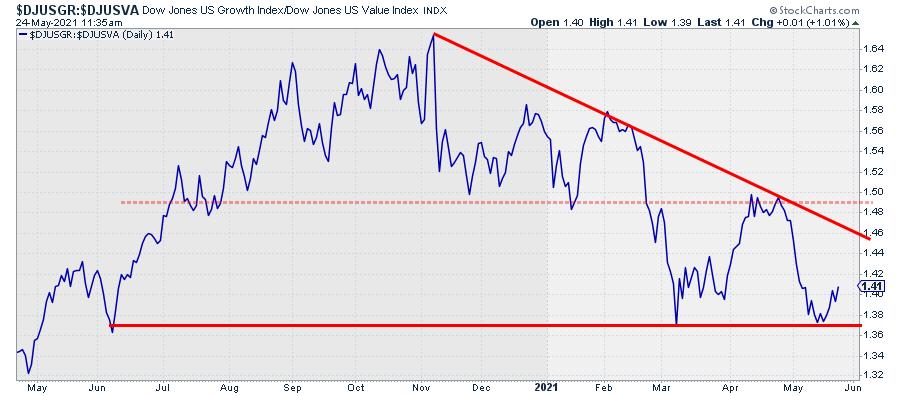
When moving to the daily version of that ratio chart, you can see that the last low that was put into place nicely lines up with the previous lows in March, as well as June last year. Again, this is not a turnaround, but it certainly looks as if we will see some relief for Growth in favor of Value in the coming days/weeks.
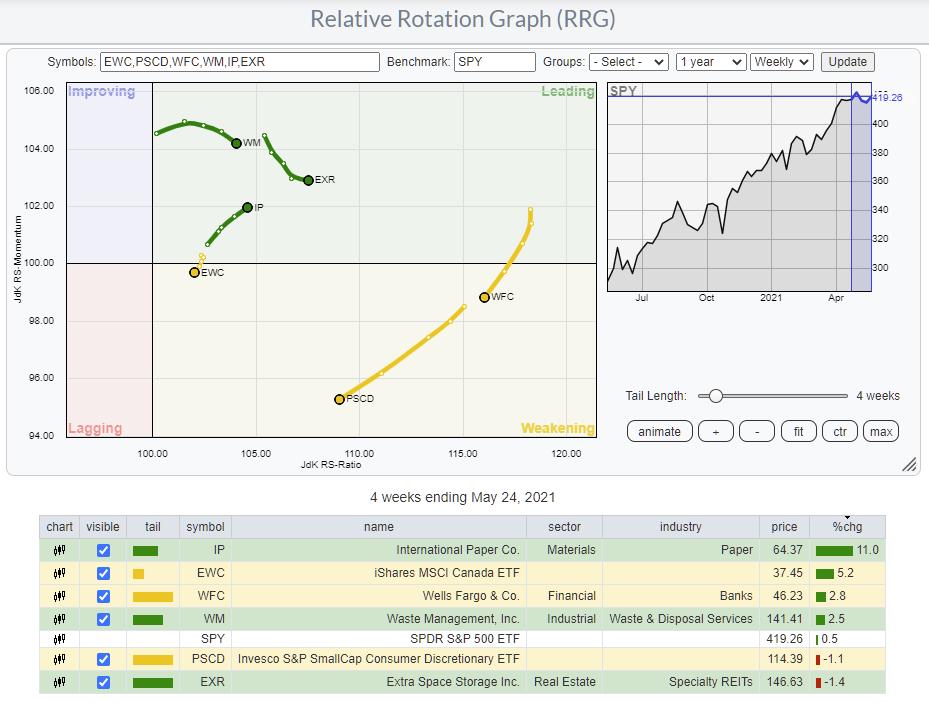
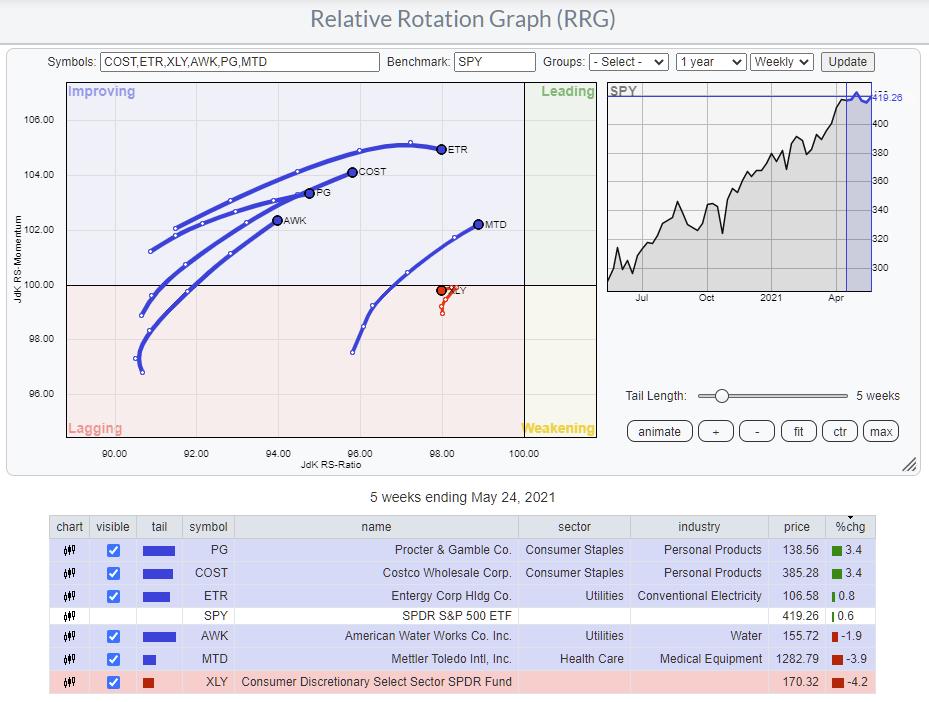
With regard to the RRG Long/Short baskets, that is enough to remove the positions in IVE and IVW and protect the profits so far. Removing IVE and IVW from the L/S baskets leaves us with the following names:
LONG
SHORT
Julius de Kempenaer
Senior Technical Analyst, StockCharts.com
Creator, Relative Rotation Graphs
Founder, RRG Research
Host of: Sector Spotlight
Please find my handles for social media channels under the Bio below.
Feedback, comments or questions are welcome at Juliusdk@stockcharts.com. I cannot promise to respond to each and every message, but I will certainly read them and, where reasonably possible, use the feedback and comments or answer questions.
To discuss RRG with me on S.C.A.N., tag me using the handle Julius_RRG.
RRG, Relative Rotation Graphs, JdK RS-Ratio, and JdK RS-Momentum are registered trademarks of RRG Research.


